Humana 2013 Annual Report Download - page 70
Download and view the complete annual report
Please find page 70 of the 2013 Humana annual report below. You can navigate through the pages in the report by either clicking on the pages listed below, or by using the keyword search tool below to find specific information within the annual report.-
 1
1 -
2
-
3
-
4
-
5
-
6
-
7
-
8
-
9
-
10
-
11
-
12
-
13
-
14
-
15
-
16
-
17
-
18
-
19
-
20
-
21
-
22
-
23
-
24
-
25
-
26
-
27
-
28
-
29
-
30
-
31
-
32
-
33
-
34
-
35
-
36
-
37
-
38
-
39
-
40
-
41
-
42
-
43
-
44
-
45
-
46
-
47
-
48
-
49
-
50
-
51
-
52
-
53
-
54
-
55
-
56
-
57
-
58
-
59
-
 60
60 -
 61
61 -
 62
62 -
 63
63 -
 64
64 -
 65
65 -
 66
66 -
 67
67 -
 68
68 -
 69
69 -
 70
70 -
 71
71 -
 72
72 -
 73
73 -
 74
74 -
 75
75 -
 76
76 -
 77
77 -
 78
78 -
 79
79 -
 80
80 -
81
-
82
-
83
-
84
-
85
-
86
-
87
-
88
-
89
-
90
-
91
-
92
-
93
-
94
-
95
-
96
-
97
-
98
-
99
-
100
-
101
-
102
-
103
-
104
-
105
-
106
-
107
-
108
-
109
-
110
-
111
-
112
-
113
-
114
-
115
-
116
-
117
-
118
-
119
-
120
-
121
-
122
-
123
-
124
-
125
-
126
-
127
-
128
-
129
-
130
-
131
-
132
-
133
-
134
-
135
-
136
-
137
-
138
-
139
-
140
-
141
-
142
-
143
-
144
-
145
-
146
-
147
-
148
-
149
-
150
-
151
-
152
-
153
-
154
-
155
-
156
-
157
-
158
-
159
-
160
-
161
-
162
-
163
-
164
-
165
-
166
-
167
-
168
 |
 |

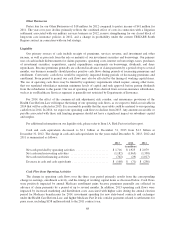
Other Businesses
Our Other Businesses pretax loss of $193 million for 2013 compared to a pretax loss of $18 million for
2012. The pretax losses in 2013 and 2012 included net expense of $243 million and $29 million, respectively, for
reserve strengthening for our closed-block of long-term care insurance policies further discussed in Note 17 to
the consolidated financial statements included in Item 8. – Financial Statements and Supplementary Data. In
addition, 2013 reflects the loss of our Medicaid contracts in Puerto Rico effective September 30, 2013 offset by
the beneficial effect of a favorable settlement of contract claims with the DoD primarily associated with litigation
settled in 2012.
Comparison of Results of Operations for 2012 and 2011
Certain financial data on a consolidated basis and for our segments was as follows for the years ended
December 31, 2012 and 2011:
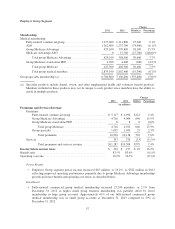
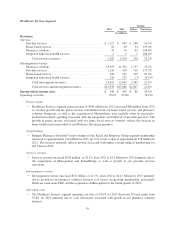
Consolidated
Change
2012 2011 Dollars Percentage
(dollars in millions, except per common share results)
Revenues:
Premiums:
Retail ............................ $25,001 $21,831 $ 3,170 14.5%
Employer Group ................... 10,138 8,877 1,261 14.2%
Other Businesses ................... 1,870 4,398 (2,528) (57.5)%
Total premiums ................ 37,009 35,106 1,903 5.4%
Services:
Retail ............................ 24 16 8 50.0%
Employer Group ................... 370 356 14 3.9%
Healthcare Services ................. 1,024 903 121 13.4%
Other Businesses ................... 308 85 223 262.4%
Total services .................. 1,726 1,360 366 26.9%
Investment income ...................... 391 366 25 6.8%
Total revenues ................. 39,126 36,832 2,294 6.2%
Operating expenses:
Benefits .............................. 30,985 28,823 2,162 7.5%
Operating costs ........................ 5,830 5,395 435 8.1%
Depreciation and amortization ............. 295 270 25 9.3%
Total operating expenses ............. 37,110 34,488 2,622 7.6%
Income from operations ...................... 2,016 2,344 (328) (14.0)%
Interest expense ............................ 105 109 (4) (3.7)%
Income before income taxes .................. 1,911 2,235 (324) (14.5)%
Provision for income taxes ................... 689 816 (127) (15.6)%
Net income ................................ $ 1,222 $ 1,419 $ (197) (13.9)%
Diluted earnings per common share ............ $ 7.47 $ 8.46 $ (0.99) (11.7)%
Benefit ratio (a) ............................ 83.7% 82.1% 1.6%
Operating cost ratio (b) ...................... 15.1% 14.8% 0.3%
Effective tax rate ........................... 36.1% 36.5% (0.4)%
(a) Represents total benefits expense as a percentage of premiums revenue.
(b) Represents total operating costs as a percentage of total revenues less investment income.
60