Humana 2013 Annual Report Download - page 53
Download and view the complete annual report
Please find page 53 of the 2013 Humana annual report below. You can navigate through the pages in the report by either clicking on the pages listed below, or by using the keyword search tool below to find specific information within the annual report.-
 1
1 -
2
-
3
-
4
-
5
-
6
-
7
-
8
-
9
-
10
-
11
-
12
-
13
-
14
-
15
-
16
-
17
-
18
-
19
-
20
-
21
-
22
-
23
-
24
-
25
-
26
-
27
-
28
-
29
-
30
-
31
-
32
-
33
-
34
-
35
-
36
-
37
-
38
-
39
-
40
-
41
-
42
-
 43
43 -
 44
44 -
 45
45 -
 46
46 -
 47
47 -
 48
48 -
 49
49 -
 50
50 -
 51
51 -
 52
52 -
 53
53 -
 54
54 -
 55
55 -
 56
56 -
 57
57 -
 58
58 -
 59
59 -
 60
60 -
 61
61 -
 62
62 -
 63
63 -
64
-
65
-
66
-
67
-
68
-
69
-
70
-
71
-
72
-
73
-
74
-
75
-
76
-
77
-
78
-
79
-
80
-
81
-
82
-
83
-
84
-
85
-
86
-
87
-
88
-
89
-
90
-
91
-
92
-
93
-
94
-
95
-
96
-
97
-
98
-
99
-
100
-
101
-
102
-
103
-
104
-
105
-
106
-
107
-
108
-
109
-
110
-
111
-
112
-
113
-
114
-
115
-
116
-
117
-
118
-
119
-
120
-
121
-
122
-
123
-
124
-
125
-
126
-
127
-
128
-
129
-
130
-
131
-
132
-
133
-
134
-
135
-
136
-
137
-
138
-
139
-
140
-
141
-
142
-
143
-
144
-
145
-
146
-
147
-
148
-
149
-
150
-
151
-
152
-
153
-
154
-
155
-
156
-
157
-
158
-
159
-
160
-
161
-
162
-
163
-
164
-
165
-
166
-
167
-
168
 |
 |

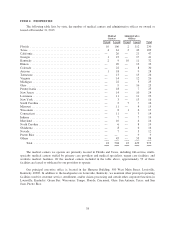
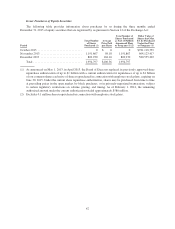
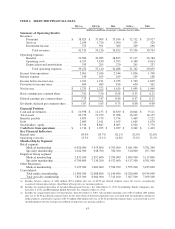
ITEM 6. SELECTED FINANCIAL DATA
2013 (a) 2012 (b) 2011 2010 (c) 2009
(dollars in millions, except per common share results)
Summary of Operating Results:
Revenues:
Premiums ..................... $ 38,829 $ 37,009 $ 35,106 $ 32,712 $ 29,927
Services ....................... 2,109 1,726 1,360 555 520
Investment income .............. 375 391 366 329 296
Total revenues .............. 41,313 39,126 36,832 33,596 30,743
Operating expenses:
Benefits ....................... 32,564 30,985 28,823 27,117 24,784
Operating costs ................. 6,355 5,830 5,395 4,380 4,014
Depreciation and amortization ..... 333 295 270 245 237
Total operating expenses ..... 39,252 37,110 34,488 31,742 29,035
Income from operations .............. 2,061 2,016 2,344 1,854 1,708
Interest expense ..................... 140 105 109 105 106
Income before income taxes ........... 1,921 1,911 2,235 1,749 1,602
Provision for income taxes ............ 690 689 816 650 562
Net income ........................ $ 1,231 $ 1,222 $ 1,419 $ 1,099 $ 1,040
Basic earnings per common share ...... $ 7.81 $ 7.56 $ 8.58 $ 6.55 $ 6.21
Diluted earnings per common share ..... $ 7.73 $ 7.47 $ 8.46 $ 6.47 $ 6.15
Dividends declared per common share . . . $ 1.07 $ 1.03 $ 0.75 $ 0.00 $ 0.00
Financial Position:
Cash and investments ................ $ 10,938 $ 11,153 $ 10,830 $ 10,046 $ 9,111
Total assets ........................ 20,735 19,979 17,708 16,103 14,153
Benefits payable .................... 3,893 3,779 3,754 3,469 3,222
Debt .............................. 2,600 2,611 1,659 1,669 1,678
Stockholders’ equity ................. 9,316 8,847 8,063 6,924 5,776
Cash flows from operations .......... $ 1,716 $ 1,923 $ 2,079 $ 2,242 $ 1,422
Key Financial Indicators:
Benefit ratio ....................... 83.9% 83.7% 82.1% 82.9% 82.8%
Operating cost ratio .................. 15.5% 15.1% 14.8% 13.2% 13.2%
Membership by Segment:
Retail segment:
Medical membership ............. 6,026,000 5,553,800 4,795,000 3,681,900 3,781,200
Specialty membership ............ 1,042,500 948,700 782,500 510,000 297,300
Employer Group segment:
Medical membership ............. 2,833,100 2,852,400 2,794,900 3,009,500 3,117,800
Specialty membership ............ 6,780,800 7,136,200 6,532,600 6,517,500 6,761,900
Other Businesses:
Medical membership ............. 3,125,200 3,682,600 3,594,700 3,595,200 3,435,000
Consolidated:
Total medical membership ........ 11,984,300 12,088,800 11,184,600 10,286,600 10,334,000
Total specialty membership ....... 7,823,300 8,084,900 7,315,100 7,027,500 7,059,200
(a) Includes benefits expense of $243 million ($154 million after tax, or $0.99 per diluted common share) for reserve strengthening
associated with our non-strategic closed block of long-term care insurance policies.
(b) Includes the acquired operations of Arcadian Management Services, Inc. from March 31, 2012, SeniorBridge Family Companies, Inc.
from July 6, 2012, and Metropolitan Health Networks, Inc. from December 21, 2012.
(c) Includes the acquired operations of Concentra Inc. from December 21, 2010. Also includes operating costs of $147 million ($93 million
after tax, or $0.55 per diluted common share) for the write-down of deferred acquisition costs associated with our individual commercial
medical policies and benefits expense of $139 million ($88 million after tax, or $0.52 per diluted common share) associated with reserve
strengthening for our non-strategic closed block of long-term care insurance policies.
43