Humana 2013 Annual Report Download - page 68
Download and view the complete annual report
Please find page 68 of the 2013 Humana annual report below. You can navigate through the pages in the report by either clicking on the pages listed below, or by using the keyword search tool below to find specific information within the annual report.-
 1
1 -
2
-
3
-
4
-
5
-
6
-
7
-
8
-
9
-
10
-
11
-
12
-
13
-
14
-
15
-
16
-
17
-
18
-
19
-
20
-
21
-
22
-
23
-
24
-
25
-
26
-
27
-
28
-
29
-
30
-
31
-
32
-
33
-
34
-
35
-
36
-
37
-
38
-
39
-
40
-
41
-
42
-
43
-
44
-
45
-
46
-
47
-
48
-
49
-
50
-
51
-
52
-
53
-
54
-
55
-
56
-
57
-
 58
58 -
 59
59 -
 60
60 -
 61
61 -
 62
62 -
 63
63 -
 64
64 -
 65
65 -
 66
66 -
 67
67 -
 68
68 -
 69
69 -
 70
70 -
 71
71 -
 72
72 -
 73
73 -
 74
74 -
 75
75 -
 76
76 -
 77
77 -
 78
78 -
79
-
80
-
81
-
82
-
83
-
84
-
85
-
86
-
87
-
88
-
89
-
90
-
91
-
92
-
93
-
94
-
95
-
96
-
97
-
98
-
99
-
100
-
101
-
102
-
103
-
104
-
105
-
106
-
107
-
108
-
109
-
110
-
111
-
112
-
113
-
114
-
115
-
116
-
117
-
118
-
119
-
120
-
121
-
122
-
123
-
124
-
125
-
126
-
127
-
128
-
129
-
130
-
131
-
132
-
133
-
134
-
135
-
136
-
137
-
138
-
139
-
140
-
141
-
142
-
143
-
144
-
145
-
146
-
147
-
148
-
149
-
150
-
151
-
152
-
153
-
154
-
155
-
156
-
157
-
158
-
159
-
160
-
161
-
162
-
163
-
164
-
165
-
166
-
167
-
168
 |
 |
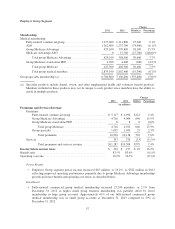
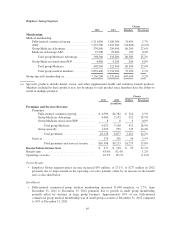
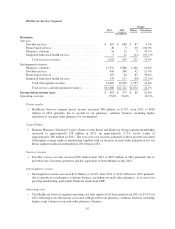
• Fully-insured group Medicare Advantage membership increased 58,300 members, or 15.7%, from
December 31, 2012 to December 31, 2013 primarily due to the January 2013 addition of a new large
group retirement account.
• Effective January 1, 2013 we lost our sole group Medicare Advantage ASO account which had 27,700
members at December 31, 2012.
• Group ASO commercial medical membership decreased 74,900 members, or 6.1%, from December 31,
2012 to December 31, 2013 primarily due to continued pricing discipline in a highly competitive
environment for self-funded accounts.
• Group specialty membership decreased 355,400 members, or 5.0%, from December 31, 2012 to
December 31, 2013 primarily due to a decline in vision membership related to our planned
discontinuance of certain unprofitable product distribution partnerships.
Premiums revenue
• Employer Group segment premiums increased $792 million, or 7.8%, from 2012 to 2013 primarily due
to higher average group Medicare Advantage medical membership.
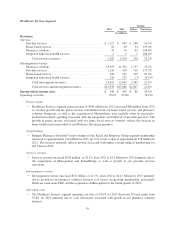
Benefits expense
• The Employer Group segment benefit ratio decreased 10 basis points from 83.6% in 2012 to 83.5% in
2013 primarily due to higher favorable prior-year medical claims reserve development, partially offset
by growth in our group Medicare Advantage products which generally carry a higher benefit ratio than
our fully-insured commercial group products. The Employer Group segment’s benefits expense
included the beneficial effect of $128 million in favorable prior-year medical claims reserve
development versus $48 million in 2012. The increase in favorable prior-year medical claims reserve
development from 2012 to 2013 primarily was driven by claims trend for the prior year ultimately
developing more favorably than originally expected and increased financial recoveries. The increase in
financial recoveries primarily resulted from claim audit process enhancements as well as increased
volume of claim audits and expanded audit scope. This favorable prior-year medical claims reserve
development decreased the Employer Group segment benefit ratio by approximately120 basis points in
2013 versus approximately 50 basis points in 2012.
Operating costs
• The Employer Group segment operating cost ratio of 16.2% decreased 30 basis points from 2012. This
decrease primarily reflects continued savings as a result of our operating cost reduction initiatives and
growth in our group Medicare Advantage products which generally carry a lower operating cost ratio
than our fully-insured commercial group products, partially offset by investment spending in
technology capabilities.
58