Humana 2013 Annual Report Download - page 71
Download and view the complete annual report
Please find page 71 of the 2013 Humana annual report below. You can navigate through the pages in the report by either clicking on the pages listed below, or by using the keyword search tool below to find specific information within the annual report.-
 1
1 -
2
-
3
-
4
-
5
-
6
-
7
-
8
-
9
-
10
-
11
-
12
-
13
-
14
-
15
-
16
-
17
-
18
-
19
-
20
-
21
-
22
-
23
-
24
-
25
-
26
-
27
-
28
-
29
-
30
-
31
-
32
-
33
-
34
-
35
-
36
-
37
-
38
-
39
-
40
-
41
-
42
-
43
-
44
-
45
-
46
-
47
-
48
-
49
-
50
-
51
-
52
-
53
-
54
-
55
-
56
-
57
-
58
-
59
-
60
-
 61
61 -
 62
62 -
 63
63 -
 64
64 -
 65
65 -
 66
66 -
 67
67 -
 68
68 -
 69
69 -
 70
70 -
 71
71 -
 72
72 -
 73
73 -
 74
74 -
 75
75 -
 76
76 -
 77
77 -
 78
78 -
 79
79 -
 80
80 -
 81
81 -
82
-
83
-
84
-
85
-
86
-
87
-
88
-
89
-
90
-
91
-
92
-
93
-
94
-
95
-
96
-
97
-
98
-
99
-
100
-
101
-
102
-
103
-
104
-
105
-
106
-
107
-
108
-
109
-
110
-
111
-
112
-
113
-
114
-
115
-
116
-
117
-
118
-
119
-
120
-
121
-
122
-
123
-
124
-
125
-
126
-
127
-
128
-
129
-
130
-
131
-
132
-
133
-
134
-
135
-
136
-
137
-
138
-
139
-
140
-
141
-
142
-
143
-
144
-
145
-
146
-
147
-
148
-
149
-
150
-
151
-
152
-
153
-
154
-
155
-
156
-
157
-
158
-
159
-
160
-
161
-
162
-
163
-
164
-
165
-
166
-
167
-
168
 |
 |
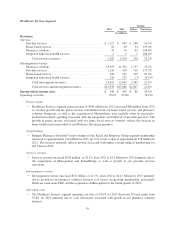
Summary
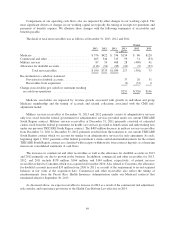
Net income was $1.2 billion, or $7.47 per diluted common share, in 2012 compared to $1.4 billion, or $8.46
per diluted common share, in 2011 primarily due to lower operating results in the Retail segment, partially offset
by improved operating performance in the Employer Group and Healthcare Services segments. During 2012, we
experienced a significant increase in the Retail segment benefit ratio primarily associated with our individual
Medicare Advantage products primarily due to a planned increase in the target benefit ratio associated with
positioning for the Health Care Reform Law funding changes and minimum benefit ratio requirements and a
higher benefit ratio experienced on new membership than the assumptions used in our 2012 Medicare bids. Our
diluted earnings per common share for 2012 included $0.18 per diluted common share for benefits expense
related to the settlement of a litigation matter associated with our military services business, as well as $0.11 per
diluted common share for benefits expense associated with reserve strengthening associated with our closed
block of long-term care insurance policies in our Other Businesses as discussed in Note 17 to the consolidated
financial statements included in Item 8. – Financial Statements and Supplementary Data.
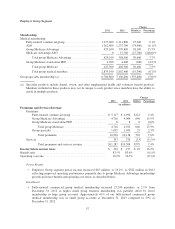
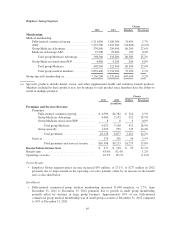
Premiums Revenue
Consolidated premiums increased $1.9 billion, or 5.4%, from 2011 to $37.0 billion for 2012 primarily due to
increases in both Retail and Employer Group segment premiums mainly driven by higher average individual and
group Medicare Advantage membership, partially offset by lower premiums for our Other Businesses due to the
transition to the current TRICARE South Region contract. As discussed previously, on April 1, 2012, we began
delivering services under the current TRICARE South Region contract that the TMA awarded to us on
February 25, 2011. We account for revenues under the current contract net of estimated healthcare costs similar
to an administrative services fee only agreement, and as such there are no premiums recognized under the current
contract. Our previous contract was accounted for similar to our fully-insured products and as such we
recognized premiums under the previous contract.
Services Revenue
Consolidated services revenue increased $366 million, or 26.9%, from 2011 to $1.7 billion for 2012,
primarily due to an increase in services revenue for our Other Businesses due to the transition to the current
TRICARE South Region contract on April 1, 2012, and an increase in services revenue in our Healthcare
Services segment from growth in our Concentra operations and the acquisition of SeniorBridge on July 6, 2012.
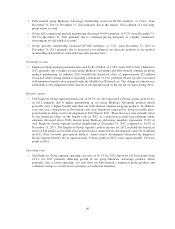
Investment Income
Investment income totaled $391 million for 2012, an increase of $25 million from 2011, primarily reflecting
net capital gains realized in 2012 as a result of ordinary portfolio management during the year.
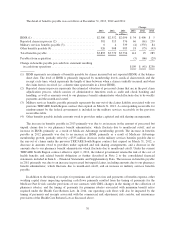
Benefits Expense
Consolidated benefits expense was $31.0 billion for 2012, an increase of $2.2 billion, or 7.5%, from 2011
primarily due to a year-over-year increase in Retail and Employer Group segment benefits expense in 2012,
mainly driven by an increase in the average number of Medicare members, partially offset by a decrease in
benefits expense for Other Businesses primarily due to the transition to the current administrative services only
TRICARE South Region contract on April 1, 2012. We do not record benefits expense under the current contract.
Our previous contract was accounted for similar to our fully-insured products and as such we recorded benefits
expense under the previous contract. Retail segment benefits expense increased $3.3 billion, or 18.5%, from 2011
to 2012 and Employer Group segment benefits expense increased $1.2 billion, or 15.8%, from 2011 to 2012. We
experienced favorable medical claims reserve development related to prior fiscal years of $257 million in 2012
and $372 million in 2011.
The consolidated benefit ratio for 2012 was 83.7%, increasing 160 basis points from the 2011 benefit ratio
of 82.1%, primarily driven by increases in both the Retail and Employer Group segments benefit ratios as
61