Toyota 2013 Annual Report Download - page 102
Download and view the complete annual report
Please find page 102 of the 2013 Toyota annual report below. You can navigate through the pages in the report by either clicking on the pages listed below, or by using the keyword search tool below to find specific information within the annual report.-
 1
1 -
2
-
3
-
4
-
5
-
6
-
7
-
8
-
9
-
10
-
11
-
12
-
13
-
14
-
15
-
16
-
17
-
18
-
19
-
20
-
21
-
22
-
23
-
24
-
25
-
26
-
27
-
28
-
29
-
30
-
31
-
32
-
33
-
34
-
35
-
36
-
37
-
38
-
39
-
40
-
41
-
42
-
43
-
44
-
45
-
46
-
47
-
48
-
49
-
50
-
51
-
52
-
53
-
54
-
55
-
56
-
57
-
58
-
59
-
60
-
61
-
62
-
63
-
64
-
65
-
66
-
67
-
68
-
69
-
70
-
71
-
72
-
73
-
74
-
75
-
76
-
77
-
78
-
79
-
80
-
81
-
82
-
83
-
84
-
85
-
86
-
87
-
88
-
89
-
90
-
91
-
 92
92 -
 93
93 -
 94
94 -
 95
95 -
 96
96 -
 97
97 -
 98
98 -
 99
99 -
 100
100 -
 101
101 -
 102
102 -
 103
103 -
 104
104 -
 105
105 -
 106
106 -
 107
107 -
 108
108 -
 109
109 -
 110
110 -
 111
111 -
 112
112 -
113
-
114
-
115
-
116
-
117
-
118
-
119
-
120
-
121
-
122
-
123
-
124
 |
 |
Toyota Global Vision President’s Message Launching a New Structure Special Feature Review of Operations
Consolidated Performance
Highlights
Management and
Corporate Information Investor InformationFinancial Section
Page 102
NextPrev
ContentsSearchPrint
ANNUAL REPORT 2013
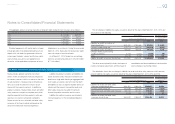
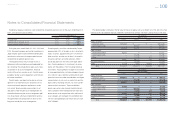
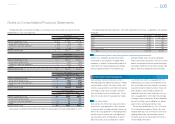
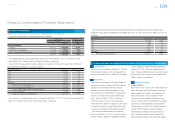
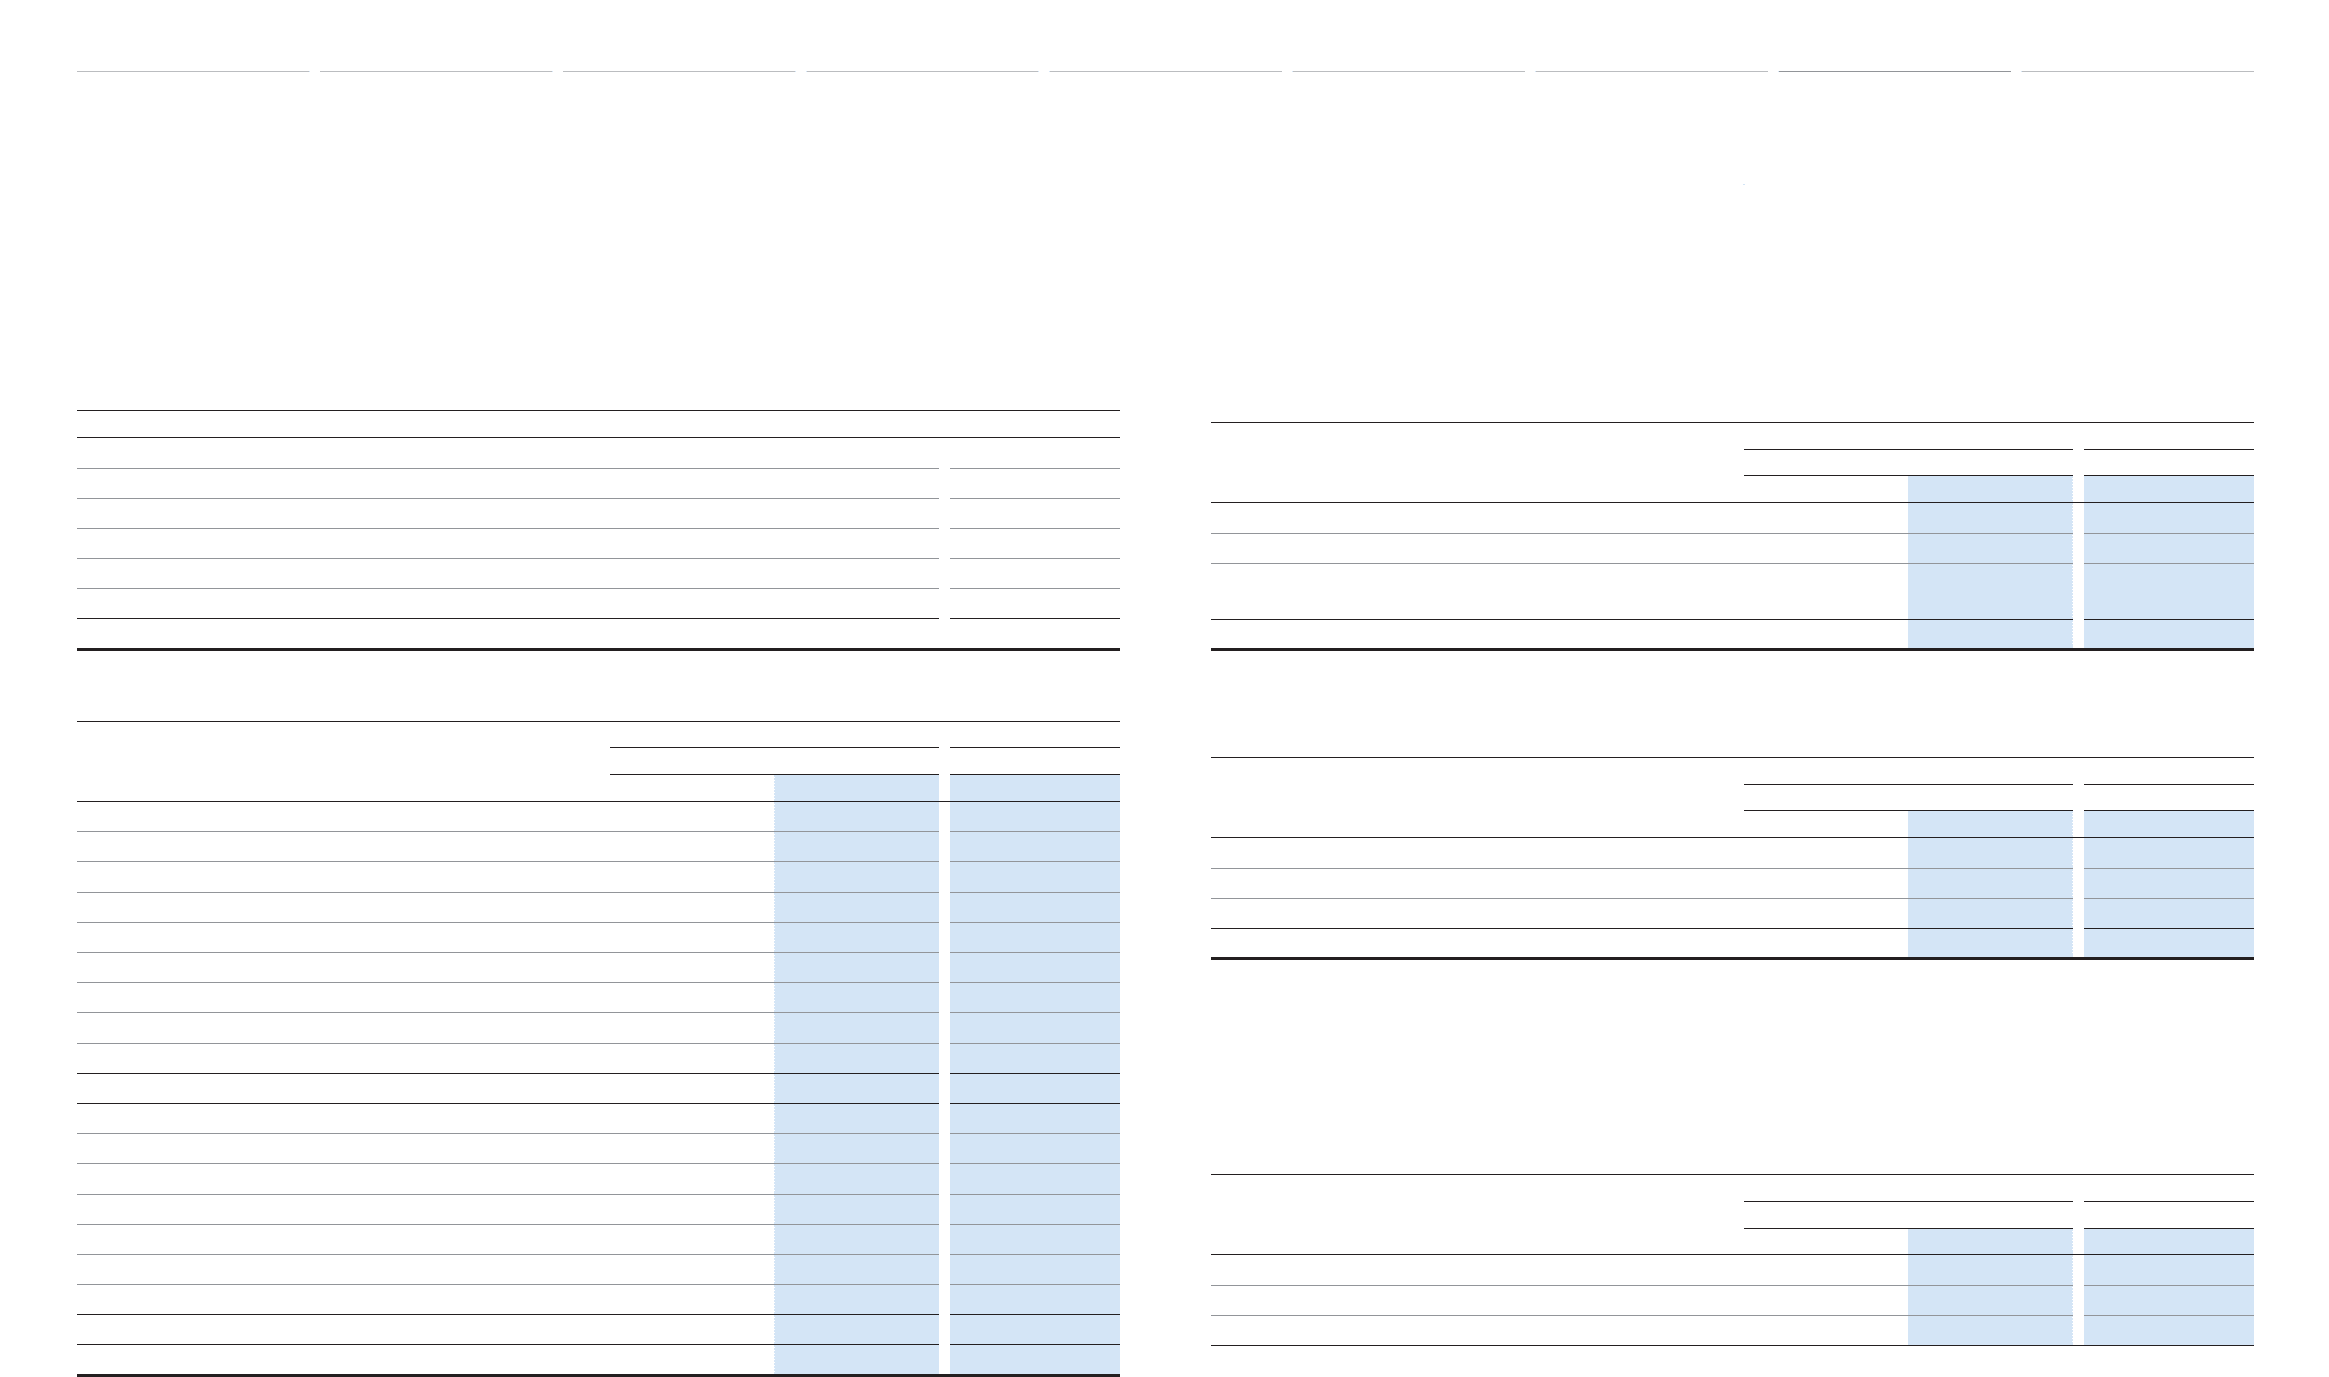
The following pension benefi t payments, which refl ect expected future service, as appropriate, are expected
to be paid:
Years ending March 31, Yen in millions U.S. dollars in millions
2014 ¥ 62,508 $ 665
2015 64,803 689
2016 66,445 706
2017 66,497 707
2018 67,780 721
from 2019 to 2023 379,369 4,034
Total ¥707,402 $7,522
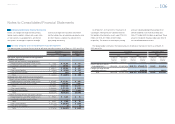
Foreign plans
Yen in millions U.S. dollars in millions
March 31, March 31,
2012 2013 2013
Change in benefi t obligation:
Benefi t obligation at beginning of year ¥367,125 ¥467,000 $4,965
Service cost 21,298 27,943 297
Interest cost 21,739 24,300 258
Plan participants’ contributions 221 246 3
Plan amendments 108 (43) (0)
Net actuarial loss 50,222 38,986 415
Acquisition and other 13,061 82,907 881
Benefi ts paid (6,774) (8,179) (87)
Benefi t obligation at end of year 467,000 633,160 6,732
Change in plan assets:
Fair value of plan assets at beginning of year 297,644 343,226 3,649
Actual return on plan assets 14,816 46,359 493
Acquisition and other 19,600 60,138 640
Employer contributions 16,125 35,354 376
Plan participants’ contributions 221 246 3
Benefi ts paid (5,180) (6,084) (65)
Fair value of plan assets at end of year 343,226 479,239 5,096
Funded status ¥123,774 ¥153,921 $1,636
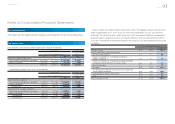
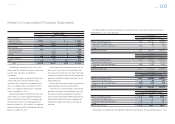
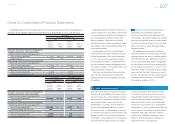
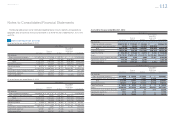
Amounts recognized in the consolidated balance sheets as of March 31, 2012 and 2013 are comprised of
the following:
Yen in millions U.S. dollars in millions
March 31, March 31,
2012 2013 2013
Accrued expenses (Accrued pension and severance costs) ¥ 1,523 ¥ 1,762 $ 18
Accrued pension and severance costs 155,306 183,621 1,953
Investments and other assets—
Other (Prepaid pension and severance costs) (33,055) (31,462) (335)
Net amount recognized ¥123,774 ¥153,921 $1,636
Amounts recognized in accumulated other comprehensive income (loss) as of March 31, 2012 and 2013
are comprised of the following:
Yen in millions U.S. dollars in millions
March 31, March 31,
2012 2013 2013
Net actuarial loss ¥(75,069) ¥(96,151) $(1,022)
Prior service costs (2,333) (1,921) (20)
Net transition obligation — ——
Net amount recognized ¥(77,402) ¥(98,072) $(1,042)
The accumulated benefi t obligation for all defi ned
benefi t pension plans was ¥385,348 million and
¥533,551 million ($5,673 million) at March 31, 2012
and 2013, respectively.
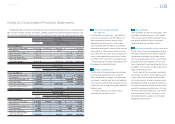
The projected benefi t obligation, accumulated benefi t obligation and fair value of plan assets for which the
accumulated benefi t obligations exceed plan assets are as follows:
Yen in millions U.S. dollars in millions
March 31, March 31,
2012 2013 2013
Projected benefi t obligation ¥229,015 ¥251,596 $2,675
Accumulated benefi t obligation 190,422 213,934 2,275
Fair value of plan assets 52,123 43,277 460
Notes to Consolidated Financial Statements
Selected Financial Summary (U.S. GAAP) Consolidated Segment Information Consolidated Quarterly Financial Summary Management’s Discussion and Analysis of Financial Condition and Results of Operations Consolidated Financial Statements Notes to Consolidated Financial Statements [25 of 44]
Management’s Annual Report on Internal Control over Financial Reporting Report of Independent Registered Public Accounting Firm