Toyota 2013 Annual Report Download - page 21
Download and view the complete annual report
Please find page 21 of the 2013 Toyota annual report below. You can navigate through the pages in the report by either clicking on the pages listed below, or by using the keyword search tool below to find specific information within the annual report.-
 1
1 -
2
-
3
-
4
-
5
-
6
-
7
-
8
-
9
-
10
-
 11
11 -
 12
12 -
 13
13 -
 14
14 -
 15
15 -
 16
16 -
 17
17 -
 18
18 -
 19
19 -
 20
20 -
 21
21 -
 22
22 -
 23
23 -
 24
24 -
 25
25 -
 26
26 -
 27
27 -
 28
28 -
 29
29 -
 30
30 -
 31
31 -
32
-
33
-
34
-
35
-
36
-
37
-
38
-
39
-
40
-
41
-
42
-
43
-
44
-
45
-
46
-
47
-
48
-
49
-
50
-
51
-
52
-
53
-
54
-
55
-
56
-
57
-
58
-
59
-
60
-
61
-
62
-
63
-
64
-
65
-
66
-
67
-
68
-
69
-
70
-
71
-
72
-
73
-
74
-
75
-
76
-
77
-
78
-
79
-
80
-
81
-
82
-
83
-
84
-
85
-
86
-
87
-
88
-
89
-
90
-
91
-
92
-
93
-
94
-
95
-
96
-
97
-
98
-
99
-
100
-
101
-
102
-
103
-
104
-
105
-
106
-
107
-
108
-
109
-
110
-
111
-
112
-
113
-
114
-
115
-
116
-
117
-
118
-
119
-
120
-
121
-
122
-
123
-
124
 |
 |
Toyota Global Vision President’s Message Launching a New Structure Special Feature Review of Operations
Consolidated Performance
Highlights
Management and
Corporate Information Investor InformationFinancial Section
Page 21
NextPrev
ContentsSearchPrint
ANNUAL REPORT 2013
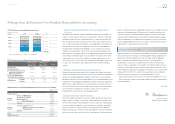
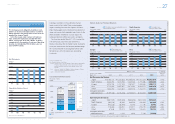
Consolidated Financial Forecasts for Fiscal 2014
For the fi scal year ending March 31, 2014, we forecast vehicle sales of 9.1
million units, net revenues of ¥23.5 trillion, operating income of ¥1.8 trillion and
net income of ¥1.37 trillion on a consolidated basis. Our exchange rate
assumptions are ¥90 per US$1 and ¥120 per €1.
In our forecast for consolidated operating income, we expect exchange-rate
fl uctuations (¥400 billion), cost reduction efforts (¥160 billion), and marketing
efforts (¥80 billion) to be contributing factors. We also expect a ¥160.8 billion
rise in expenses that will negatively affect operating income. However, the
expected increase will be largely attributable to forward-looking expenditures,
such as R&D aimed at making ever-better cars. As such, we view these
expenses as necessary investments for future growth. Meanwhile, we will
continue working to steadily improve earnings in our daily operations, including
through companywide value analysis (VA) activities and other cost reduction
efforts as well as measures to promote sales effi ciency.
We have been aiming to establish a cycle of developing cars that delight our
customers and benefi t society while fulfi lling our duty to increase sales and
consequently profi ts that are then reinvested in developing ever-better cars. To
support this cycle, we aim to maintain and build on a strong earnings base
through marketing, suitable controls on fi xed costs and thorough cost reductions.
Financial Strategy
The three key priorities of our fi nancial strategy are growth, effi ciency and
stability.
We believe that the balanced pursuit of these three priorities over the
medium to long term will allow us to achieve steady and sustainable growth, as
well as increase corporate value.
Message from the Executive Vice President Responsible for Accounting
We aim to achieve
sustainable growth by
maintaining and
building on a strong
earnings base.
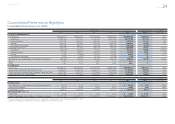
Fiscal 2013 Business Results
On a consolidated basis for the fi scal year ended March 31, 2013, vehicle sales
increased 1.519 million units to 8.871 million units compared with the previous
fi scal year. Net revenues expanded ¥3.4805 trillion to ¥22.0641 trillion, operat-
ing income grew ¥965.2 billion to ¥1.3208 trillion, and net income rose ¥678.6
billion to ¥962.1 billion.
Factors that contributed to operating income included ¥650.0 billion from
marketing efforts, ¥450.0 billion from cost reduction efforts, ¥150.0 billion due
to exchange-rate fl uctuations, and ¥15.2 billion due to other factors. Factors
that were detrimental to operating income included a ¥300.0 billion rise in
expenses. With regard to marketing, the volume of sales was higher in all
regions owing to supply shortages in the previous fi scal year caused by the
Great East Japan Earthquake and fl ooding in Thailand. In Japan, sales
increased during fi scal 2013 due in part to the invigorating effect of eco-car
subsidies on the market. In North America, sales of such mainstay models as
the Corolla and Camry remained strong amid robust demand. In Asia, sales
volumes grew substantially as the company rode market growth in each coun-
try, especially in Thailand and Indonesia. Operating income also received a
signifi cant boost from a drive to reduce costs undertaken together with our
suppliers throughout the fi scal year as well as a weakening of the yen in the
second half of the fi scal year.
I believe these results have positioned the company within reach of accom-
plishing its objective of creating a strong earnings base under the Toyota Global
Vision announced in 2011.
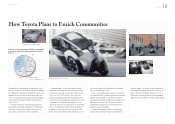
Making Ever-Better Cars Enriching Lives of Communities Stable Base of Business [2 of 4]