Toyota 2013 Annual Report Download - page 112
Download and view the complete annual report
Please find page 112 of the 2013 Toyota annual report below. You can navigate through the pages in the report by either clicking on the pages listed below, or by using the keyword search tool below to find specific information within the annual report.-
 1
1 -
2
-
3
-
4
-
5
-
6
-
7
-
8
-
9
-
10
-
11
-
12
-
13
-
14
-
15
-
16
-
17
-
18
-
19
-
20
-
21
-
22
-
23
-
24
-
25
-
26
-
27
-
28
-
29
-
30
-
31
-
32
-
33
-
34
-
35
-
36
-
37
-
38
-
39
-
40
-
41
-
42
-
43
-
44
-
45
-
46
-
47
-
48
-
49
-
50
-
51
-
52
-
53
-
54
-
55
-
56
-
57
-
58
-
59
-
60
-
61
-
62
-
63
-
64
-
65
-
66
-
67
-
68
-
69
-
70
-
71
-
72
-
73
-
74
-
75
-
76
-
77
-
78
-
79
-
80
-
81
-
82
-
83
-
84
-
85
-
86
-
87
-
88
-
89
-
90
-
91
-
92
-
93
-
94
-
95
-
96
-
97
-
98
-
99
-
100
-
101
-
 102
102 -
 103
103 -
 104
104 -
 105
105 -
 106
106 -
 107
107 -
 108
108 -
 109
109 -
 110
110 -
 111
111 -
 112
112 -
 113
113 -
 114
114 -
 115
115 -
 116
116 -
 117
117 -
 118
118 -
 119
119 -
 120
120 -
 121
121 -
 122
122 -
123
-
124
 |
 |
Toyota Global Vision President’s Message Launching a New Structure Special Feature Review of Operations
Consolidated Performance
Highlights
Management and
Corporate Information Investor InformationFinancial Section
Page 112
NextPrev
ContentsSearchPrint
ANNUAL REPORT 2013
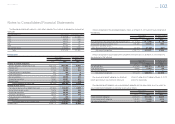
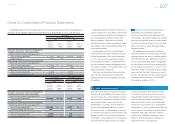
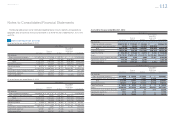
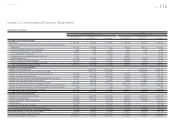
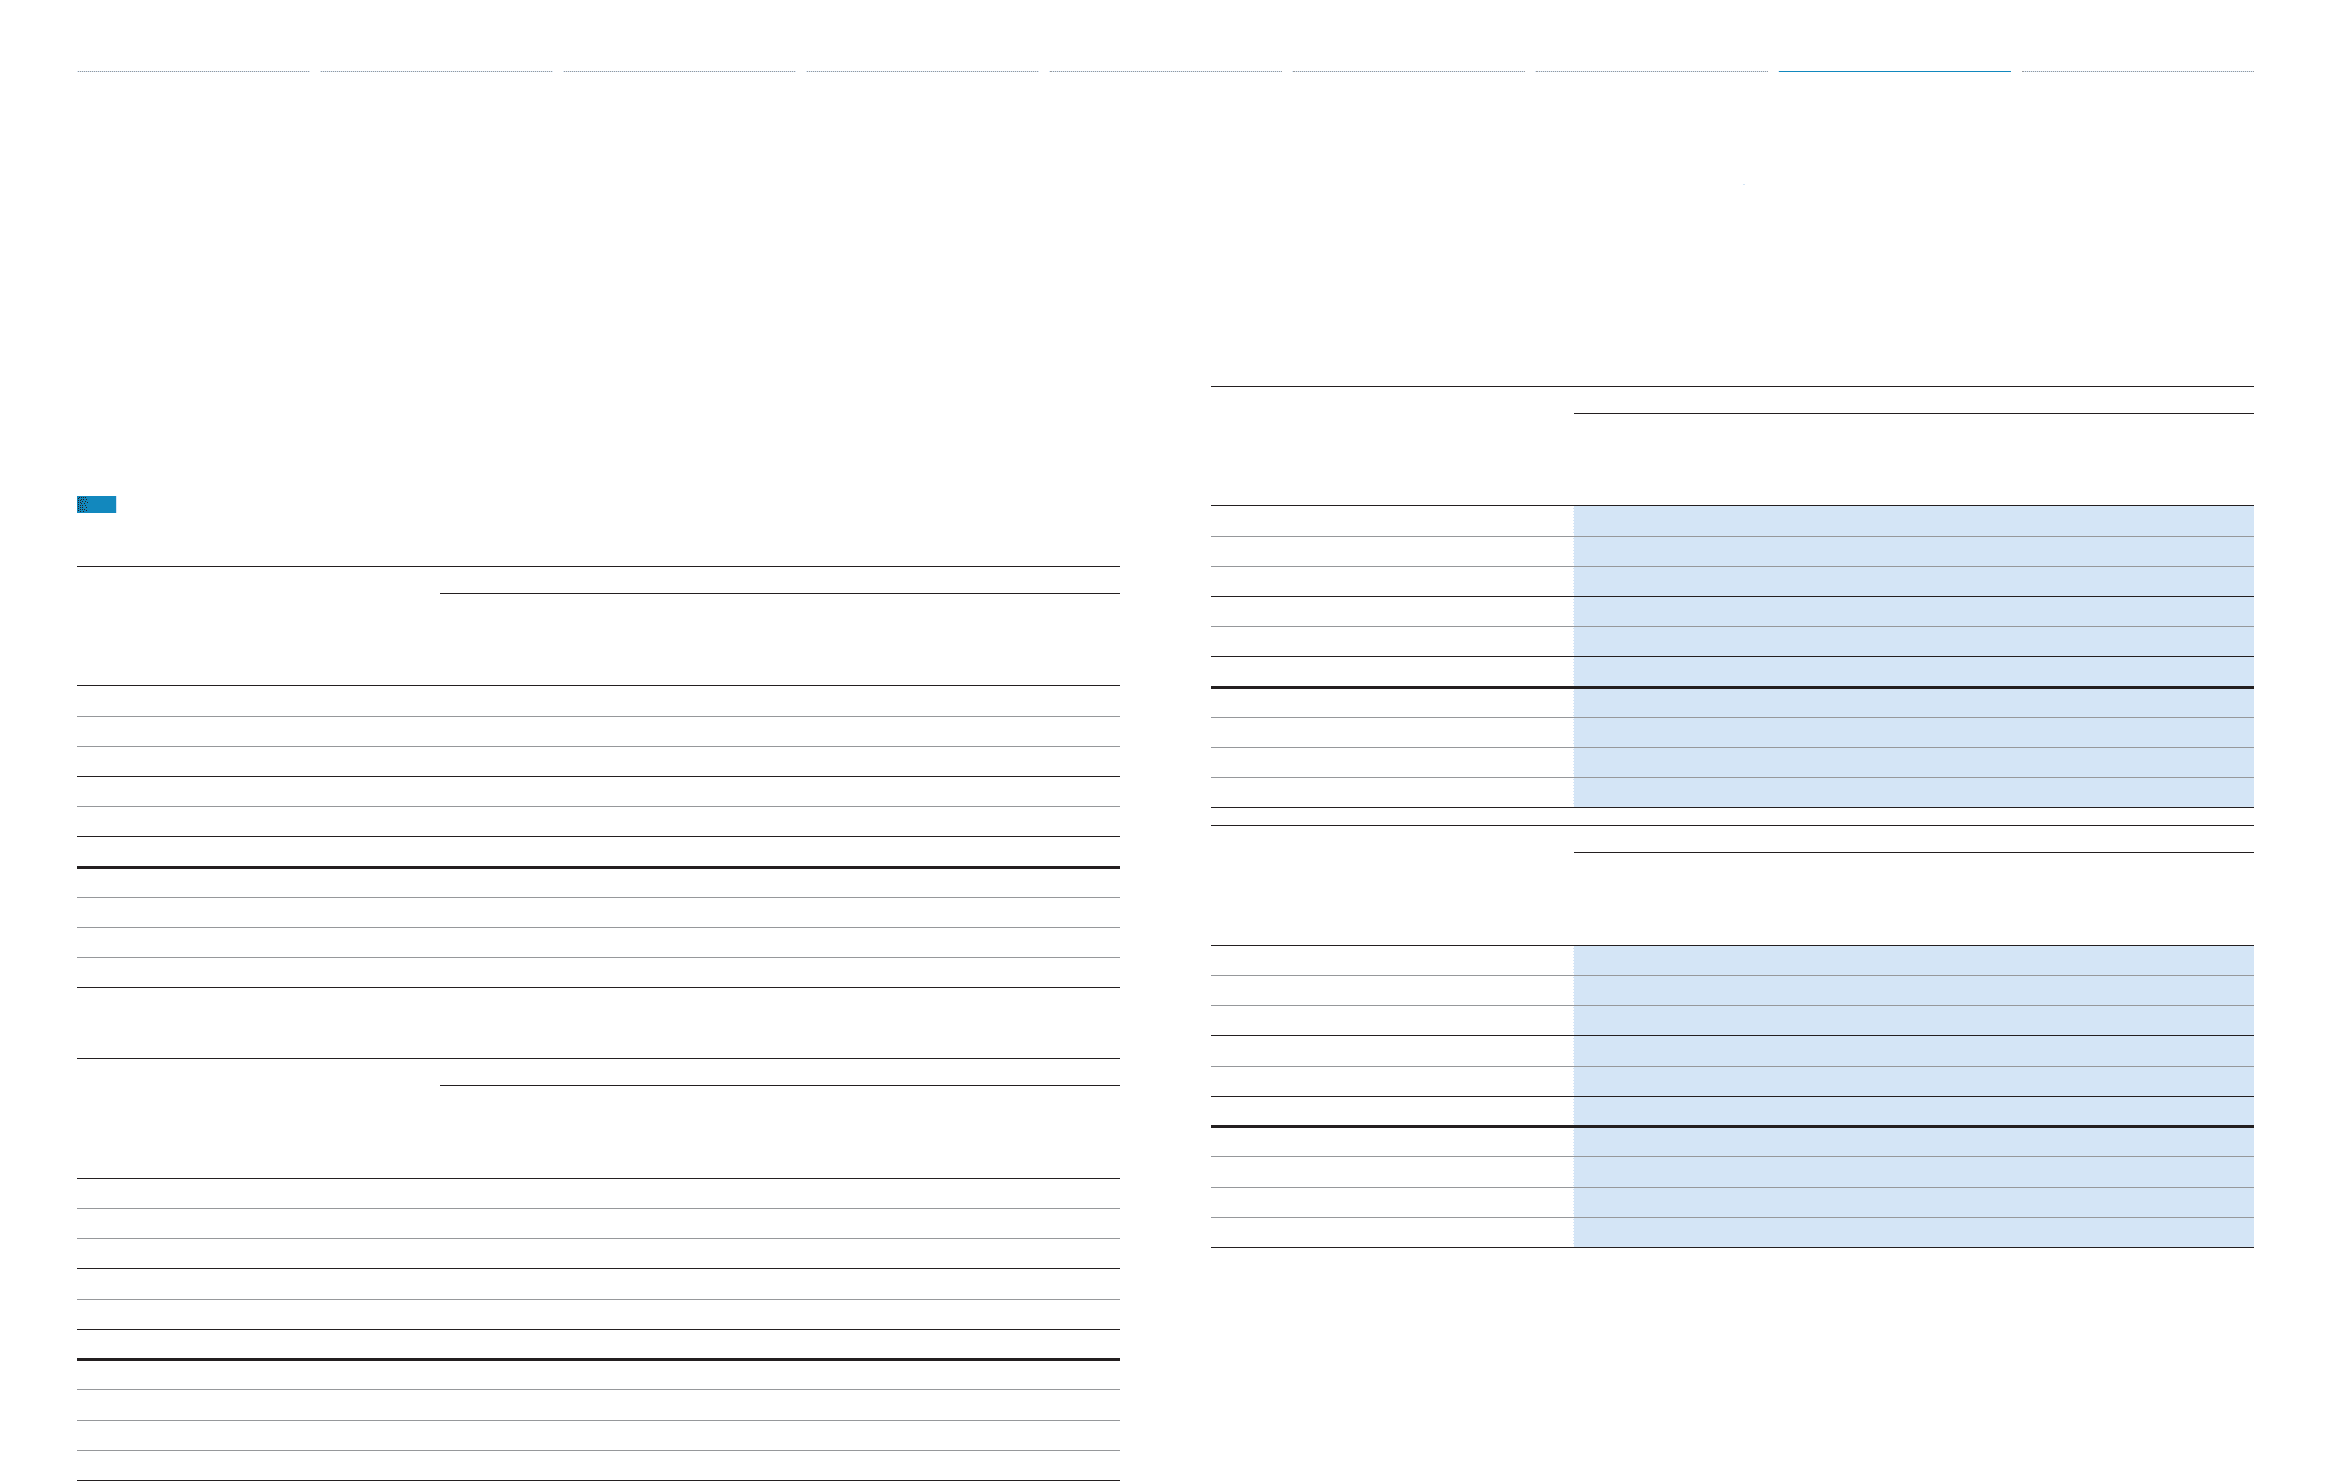
The following tables present certain information regarding Toyota’s industry segments and operations by
geographic areas and overseas revenues by destination as of and for the years ended March 31, 2011, 2012
and 2013.
Segment operating results and assets
As of and for the year ended March 31, 2011:
Yen in millions
Automotive
Financial
Services All Other
Inter-segment
Elimination/
Unallocated
Amount Consolidated
Net revenues
Sales to external customers ¥17,322,753 ¥ 1,173,168 ¥ 497,767 ¥ — ¥18,993,688
Inter-segment sales and transfers 14,567 19,037 474,485 (508,089) —
Total 17,337,320 1,192,205 972,252 (508,089) 18,993,688
Operating expenses 17,251,347 833,925 937,010 (496,873) 18,525,409
Operating income ¥ 85,973 ¥ 358,280 ¥ 35,242 ¥ (11,216) ¥ 468,279
Assets ¥11,341,558 ¥13,365,394 ¥1,146,720 ¥3,964,494 ¥29,818,166
Investment in equity method investees 1,784,539 3,519 3,045 26,885 1,817,988
Depreciation expenses 819,075 330,865 25,633 — 1,175,573
Capital expenditure 691,867 991,330 21,058 (13,064) 1,691,191
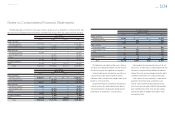
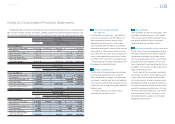
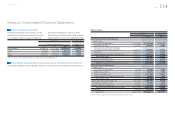
As of and for the year ended March 31, 2012:
Yen in millions
Automotive
Financial
Services All Other
Inter-segment
Elimination/
Unallocated
Amount Consolidated
Net revenues
Sales to external customers ¥16,964,378 ¥ 1,071,737 ¥ 547,538 ¥ — ¥18,583,653
Inter-segment sales and transfers 30,168 28,587 501,377 (560,132) —
Total 16,994,546 1,100,324 1,048,915 (560,132) 18,583,653
Operating expenses 16,972,863 793,886 1,006,853 (545,576) 18,228,026
Operating income ¥ 21,683 ¥ 306,438 ¥ 42,062 ¥ (14,556) ¥ 355,627
Assets ¥12,261,814 ¥13,172,548 ¥1,161,224 ¥4,055,379 ¥30,650,965
Investment in equity method investees 1,877,720 3,887 4,765 27,757 1,914,129
Depreciation expenses 744,067 298,757 25,006 — 1,067,830
Capital expenditure 796,839 683,161 35,340 16,742 1,532,082
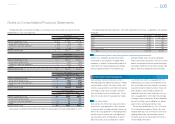
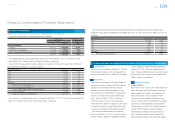
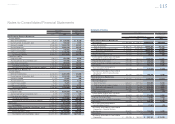
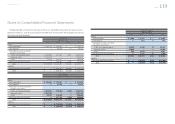
As of and for the year ended March 31, 2013:
Yen in millions
Automotive
Financial
Services All Other
Inter-segment
Elimination/
Unallocated
Amount Consolidated
Net revenues
Sales to external customers ¥20,378,762 ¥ 1,150,042 ¥ 535,388 ¥ — ¥22,064,192
Inter-segment sales and transfers 40,338 20,628 531,073 (592,039) —
Total 20,419,100 1,170,670 1,066,461 (592,039) 22,064,192
Operating expenses 19,474,396 854,850 1,012,845 (598,787) 20,743,304
Operating income ¥ 944,704 ¥ 315,820 ¥ 53,616 ¥ 6,748 ¥ 1,320,888
Assets ¥13,179,741 ¥16,231,473 ¥1,310,115 ¥4,761,988 ¥35,483,317
Investment in equity method investees 2,033,040 4,925 6,968 57,651 2,102,584
Depreciation expenses 745,880 336,528 22,701 — 1,105,109
Capital expenditure 937,695 1,005,326 29,286 1,845 1,974,152
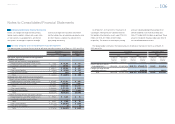
U.S. dollars in millions
Automotive
Financial
Services All Other
Inter-segment
Elimination/
Unallocated
Amount Consolidated
Net revenues
Sales to external customers $216,680 $ 12,228 $ 5,693 $ — $234,601
Inter-segment sales and transfers 429 219 5,646 (6,294) —
Total 217,109 12,447 11,339 (6,294) 234,601
Operating expenses 207,064 9,089 10,769 (6,366) 220,556
Operating income $ 10,045 $ 3,358 $ 570 $ 72 $ 14,045
Assets $140,135 $172,583 $13,930 $50,633 $377,281
Investment in equity method investees 21,617 52 74 613 22,356
Depreciation expenses 7,931 3,578 241 — 11,750
Capital expenditure 9,970 10,689 311 20 20,990
Notes to Consolidated Financial Statements
Selected Financial Summary (U.S. GAAP) Consolidated Segment Information Consolidated Quarterly Financial Summary Management’s Discussion and Analysis of Financial Condition and Results of Operations Consolidated Financial Statements Notes to Consolidated Financial Statements [35 of 44]
Management’s Annual Report on Internal Control over Financial Reporting Report of Independent Registered Public Accounting Firm