Toyota 2013 Annual Report Download - page 54
Download and view the complete annual report
Please find page 54 of the 2013 Toyota annual report below. You can navigate through the pages in the report by either clicking on the pages listed below, or by using the keyword search tool below to find specific information within the annual report.-
 1
1 -
2
-
3
-
4
-
5
-
6
-
7
-
8
-
9
-
10
-
11
-
12
-
13
-
14
-
15
-
16
-
17
-
18
-
19
-
20
-
21
-
22
-
23
-
24
-
25
-
26
-
27
-
28
-
29
-
30
-
31
-
32
-
33
-
34
-
35
-
36
-
37
-
38
-
39
-
40
-
41
-
42
-
43
-
 44
44 -
 45
45 -
 46
46 -
 47
47 -
 48
48 -
 49
49 -
 50
50 -
 51
51 -
 52
52 -
 53
53 -
 54
54 -
 55
55 -
 56
56 -
 57
57 -
 58
58 -
 59
59 -
 60
60 -
 61
61 -
 62
62 -
 63
63 -
 64
64 -
65
-
66
-
67
-
68
-
69
-
70
-
71
-
72
-
73
-
74
-
75
-
76
-
77
-
78
-
79
-
80
-
81
-
82
-
83
-
84
-
85
-
86
-
87
-
88
-
89
-
90
-
91
-
92
-
93
-
94
-
95
-
96
-
97
-
98
-
99
-
100
-
101
-
102
-
103
-
104
-
105
-
106
-
107
-
108
-
109
-
110
-
111
-
112
-
113
-
114
-
115
-
116
-
117
-
118
-
119
-
120
-
121
-
122
-
123
-
124
 |
 |

Toyota Global Vision President’s Message Launching a New Structure Special Feature Review of Operations
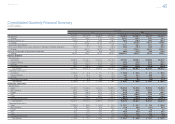
Consolidated Performance
Highlights
Management and
Corporate Information Investor InformationFinancial Section
Page 54
NextPrev
ContentsSearchPrint
ANNUAL REPORT 2013
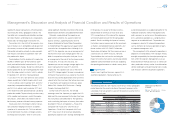
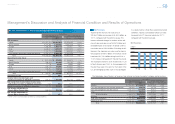
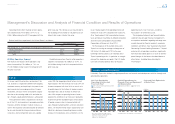
Toyota’s operating income increased by ¥965.2 bil-
lion, or 271.4%, to ¥1,320.8 billion during fi scal
2013 compared with the prior fi scal year. This
increase was due mainly to the ¥650.0 billion
increase of marketing efforts, the ¥450.0 billion
impact of cost reduction efforts and the ¥150.0 bil-
lion favorable impact of changes in exchange rates,
partially offset by the ¥300.0 billion increase in mis-
cellaneous costs and others. The increase in mis-
cellaneous costs and others was due mainly to the
¥90.0 billion charge for costs related to the settle-
ment of the economic loss claims in the consolidated
federal action in the U.S., the ¥70.0 billion increase in
labor costs, the ¥50.0 billion impact of increase in
product quality related expenses and the ¥20.0 bil-
lion increase in research and development expenses.
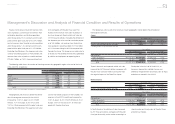
During fi scal 2013, operating income (before
elimination of intersegment profi ts), increased by
¥783.3 billion in Japan compared with the prior fi scal
year, ¥35.5 billion, or 19.1%, in North America, ¥8.6
billion, or 48.7%, in Europe, ¥119.2 billion, or 46.4%,
in Asia, and ¥24.9 billion, or 22.9%, in Other.
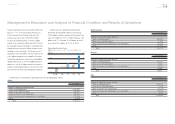
North America
Yen in millions
2013 vs. 2012 Change
Changes in operating income and loss:
Effect of marketing efforts ¥30,000
Effect of cost reduction efforts 50,000
Effect of increase of miscellaneous costs and others (65,000)
Other 20,516
Total ¥35,516
Europe
Yen in millions
2013 vs. 2012 Change
Changes in operating income and loss:
Effect of marketing efforts ¥5,000
Effect of cost reduction efforts 5,000
Effect of increase of miscellaneous costs and others (5,000)
Other 3,666
Total ¥8,666
Asia
Yen in millions
2013 vs. 2012 Change
Changes in operating income and loss:
Effect of marketing efforts ¥135,000
Effect of cost reduction efforts 15,000
Effect of changes in exchange rates (10,000)
Effect of increase of miscellaneous costs and others (30,000)
Other 9,265
Total ¥119,265
1,500
-500
15
1,000 10
5
500
-5
00
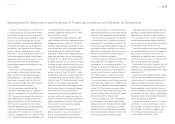
Operating Income (Loss)
왎왎 Operating income (loss) 쎲쎲 % of net revenues (Right scale)
(¥ Billion)
FY
(%)
’09 ’10 ’11 ’12 ’13
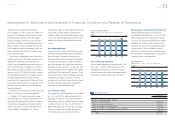
The following is a description of operating income in each geographic market.
Japan
Yen in millions
2013 vs. 2012 Change
Changes in operating income and loss:
Effect of marketing efforts ¥415,000
Effect of cost reduction efforts 380,000
Effect of changes in exchange rates 165,000
Effect of increase of miscellaneous costs and others (170,000)
Other (6,625)
Total ¥783,375
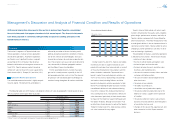
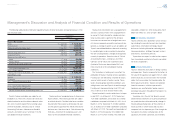
Management’s Discussion and Analysis of Financial Condition and Results of Operations
Selected Financial Summary (U.S. GAAP) Consolidated Segment Information Consolidated Quarterly Financial Summary Management’s Discussion and Analysis of Financial Condition and Results of Operations [9 of 26] Consolidated Financial Statements Notes to Consolidated Financial Statements
Management’s Annual Report on Internal Control over Financial Reporting Report of Independent Registered Public Accounting Firm