Toyota 2013 Annual Report Download - page 83
Download and view the complete annual report
Please find page 83 of the 2013 Toyota annual report below. You can navigate through the pages in the report by either clicking on the pages listed below, or by using the keyword search tool below to find specific information within the annual report.-
 1
1 -
2
-
3
-
4
-
5
-
6
-
7
-
8
-
9
-
10
-
11
-
12
-
13
-
14
-
15
-
16
-
17
-
18
-
19
-
20
-
21
-
22
-
23
-
24
-
25
-
26
-
27
-
28
-
29
-
30
-
31
-
32
-
33
-
34
-
35
-
36
-
37
-
38
-
39
-
40
-
41
-
42
-
43
-
44
-
45
-
46
-
47
-
48
-
49
-
50
-
51
-
52
-
53
-
54
-
55
-
56
-
57
-
58
-
59
-
60
-
61
-
62
-
63
-
64
-
65
-
66
-
67
-
68
-
69
-
70
-
71
-
72
-
 73
73 -
 74
74 -
 75
75 -
 76
76 -
 77
77 -
 78
78 -
 79
79 -
 80
80 -
 81
81 -
 82
82 -
 83
83 -
 84
84 -
 85
85 -
 86
86 -
 87
87 -
 88
88 -
 89
89 -
 90
90 -
 91
91 -
 92
92 -
 93
93 -
94
-
95
-
96
-
97
-
98
-
99
-
100
-
101
-
102
-
103
-
104
-
105
-
106
-
107
-
108
-
109
-
110
-
111
-
112
-
113
-
114
-
115
-
116
-
117
-
118
-
119
-
120
-
121
-
122
-
123
-
124
 |
 |

Toyota Global Vision President’s Message Launching a New Structure Special Feature Review of Operations
Consolidated Performance
Highlights
Management and
Corporate Information Investor InformationFinancial Section
Page 83
NextPrev
ContentsSearchPrint
ANNUAL REPORT 2013
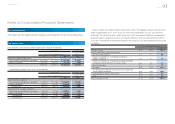
the balance sheets. This guidance is effective for fi s-
cal year beginning on or after January 1, 2013, and
for interim period within the fi scal year. Management
does not expect this guidance to have a material
impact on Toyota’s consolidated fi nancial statements.
In February 2013, FASB issued updated guidance
on the presentation of items reclassifi ed out of
accumulated other comprehensive income. This
guidance requires to present, either in a single note
or parenthetically on the face of the fi nancial state-
ments, the effect of signifi cant amounts reclassifi ed
out of each component of accumulated other
comprehensive income based on its source. This
guidance is effective for fi scal year beginning on or
after December 15, 2012, and for interim period
within the fi scal year. Management does not expect
this guidance to have a material impact on Toyota’s
consolidated fi nancial statements.
Reclassifi cations
Certain prior year amounts have been reclassifi ed to
conform to the presentations as of and for the year
ended March 31, 2013.
U.S. dollar amounts presented in the consolidated
fi nancial statements and related notes are included
solely for the convenience of the reader and are
unaudited. These translations should not be con-
strued as representations that the yen amounts
actually represent, or have been or could be
converted into, U.S. dollars. For this purpose, the
rate of ¥94.05 = U.S. $1, the approximate current
exchange rate at March 31, 2013, was used for the
translation of the accompanying consolidated fi nan-
cial amounts of Toyota as of and for the year ended
March 31, 2013.
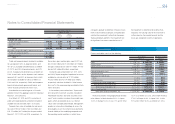
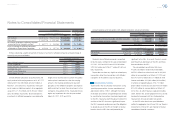
3. U.S. dollar amounts
Cash payments for income taxes were ¥211,487
million, ¥282,440 million and ¥331,007 million
($3,519 million) for the years ended March 31, 2011,
2012 and 2013, respectively. Interest payments during
the years ended March 31, 2011, 2012 and 2013
were ¥382,903 million, ¥365,109 million and
¥325,575 million ($3,462 million), respectively.
Capital lease obligations of ¥10,478 million,
¥5,847 million and ¥3,749 million ($40 million) were
incurred for the years ended March 31, 2011, 2012
and 2013, respectively.
4. Supplemental cash fl ow information
During the years ended March 31, 2011, 2012 and
2013, Toyota made several acquisitions and
dispositions, however the assets and liabilities
acquired or transferred were not material.
5. Acquisitions and dispositions
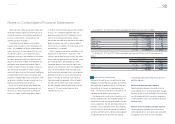
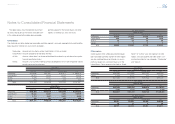
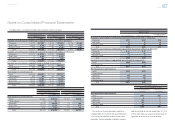
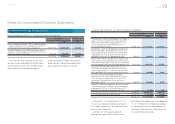
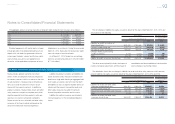
Marketable securities and other securities investments include public and corporate bonds and common
stocks for which the aggregate cost, gross unrealized gains and losses and fair value are as follows:
Yen in millions
March 31, 2012
Cost
Gross
unrealized
gains
Gross
unrealized
losses Fair value
Available-for-sale:
Public and corporate bonds ¥3,606,290 ¥ 74,357 ¥51,147 ¥3,629,500
Common stocks 605,889 444,073 15,643 1,034,319
Other 449,393 19,974 11 469,356
Total ¥4,661,572 ¥538,404 ¥66,801 ¥5,133,175
Securities not practicable to determine fair value:
Public and corporate bonds ¥ 22,047
Common stocks 79,420
Total ¥ 101,467
Yen in millions
March 31, 2013
Cost
Gross
unrealized
gains
Gross
unrealized
losses Fair value
Available-for-sale:
Public and corporate bonds ¥4,350,942 ¥ 211,070 ¥ 8,866 ¥4,553,146
Common stocks 599,371 804,405 2,593 1,401,183
Other 537,272 31,416 2 568,686
Total ¥5,487,585 ¥1,046,891 ¥11,461 ¥6,523,015
Securities not practicable to determine fair value:
Public and corporate bonds ¥ 20,148
Common stocks 79,082
Total ¥ 99,230
6. Marketable securities and other securities investments
Notes to Consolidated Financial Statements
Selected Financial Summary (U.S. GAAP) Consolidated Segment Information Consolidated Quarterly Financial Summary Management’s Discussion and Analysis of Financial Condition and Results of Operations Consolidated Financial Statements Notes to Consolidated Financial Statements [6 of 44]
Management’s Annual Report on Internal Control over Financial Reporting Report of Independent Registered Public Accounting Firm