Toyota 2013 Annual Report Download - page 51
Download and view the complete annual report
Please find page 51 of the 2013 Toyota annual report below. You can navigate through the pages in the report by either clicking on the pages listed below, or by using the keyword search tool below to find specific information within the annual report.-
 1
1 -
2
-
3
-
4
-
5
-
6
-
7
-
8
-
9
-
10
-
11
-
12
-
13
-
14
-
15
-
16
-
17
-
18
-
19
-
20
-
21
-
22
-
23
-
24
-
25
-
26
-
27
-
28
-
29
-
30
-
31
-
32
-
33
-
34
-
35
-
36
-
37
-
38
-
39
-
40
-
 41
41 -
 42
42 -
 43
43 -
 44
44 -
 45
45 -
 46
46 -
 47
47 -
 48
48 -
 49
49 -
 50
50 -
 51
51 -
 52
52 -
 53
53 -
 54
54 -
 55
55 -
 56
56 -
 57
57 -
 58
58 -
 59
59 -
 60
60 -
 61
61 -
62
-
63
-
64
-
65
-
66
-
67
-
68
-
69
-
70
-
71
-
72
-
73
-
74
-
75
-
76
-
77
-
78
-
79
-
80
-
81
-
82
-
83
-
84
-
85
-
86
-
87
-
88
-
89
-
90
-
91
-
92
-
93
-
94
-
95
-
96
-
97
-
98
-
99
-
100
-
101
-
102
-
103
-
104
-
105
-
106
-
107
-
108
-
109
-
110
-
111
-
112
-
113
-
114
-
115
-
116
-
117
-
118
-
119
-
120
-
121
-
122
-
123
-
124
 |
 |
Toyota Global Vision President’s Message Launching a New Structure Special Feature Review of Operations
Consolidated Performance
Highlights
Management and
Corporate Information Investor InformationFinancial Section
Page 51
NextPrev
ContentsSearchPrint
ANNUAL REPORT 2013
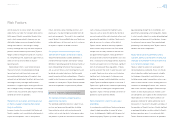
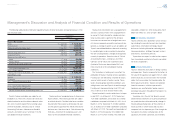
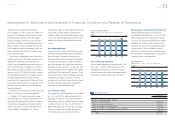
Toyota’s net revenues include net revenues from
sales of products, consisting of net revenues from
automotive operations and all other operations,
which increased by 19.4% during fi scal 2013 com-
pared with the prior fi scal year to ¥20,914.1 billion,
and net revenues from fi nancial services operations
which increased by 7.3% during fi scal 2013 com-
pared with the prior fi scal year to ¥1,150.0 billion.
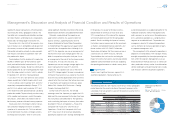
Excluding the difference in the Japanese yen value
used for translation purposes of ¥246.0 billion, net
revenues from sales of products would have been
¥20,668.1 billion, an 18.0% increase during fi scal
2013 compared with the prior fi scal year. The
increase in net revenues from sales of products is
due to an increase in Toyota vehicle unit sales by
1,519 thousand vehicles. Excluding the difference in
the Japanese yen value used for translation purpos-
es of ¥35.8 billion, net revenues from fi nancial ser-
vices operations would have been ¥1,114.2 billion,
a 4.0% increase during fi scal 2013 compared with
the prior fi scal year. This increase was mainly due to
an increase of ¥25.8 billion rental revenue generated
by vehicles and equipment on operating lease.
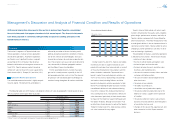
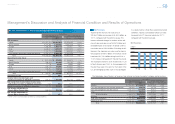
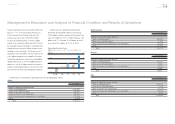
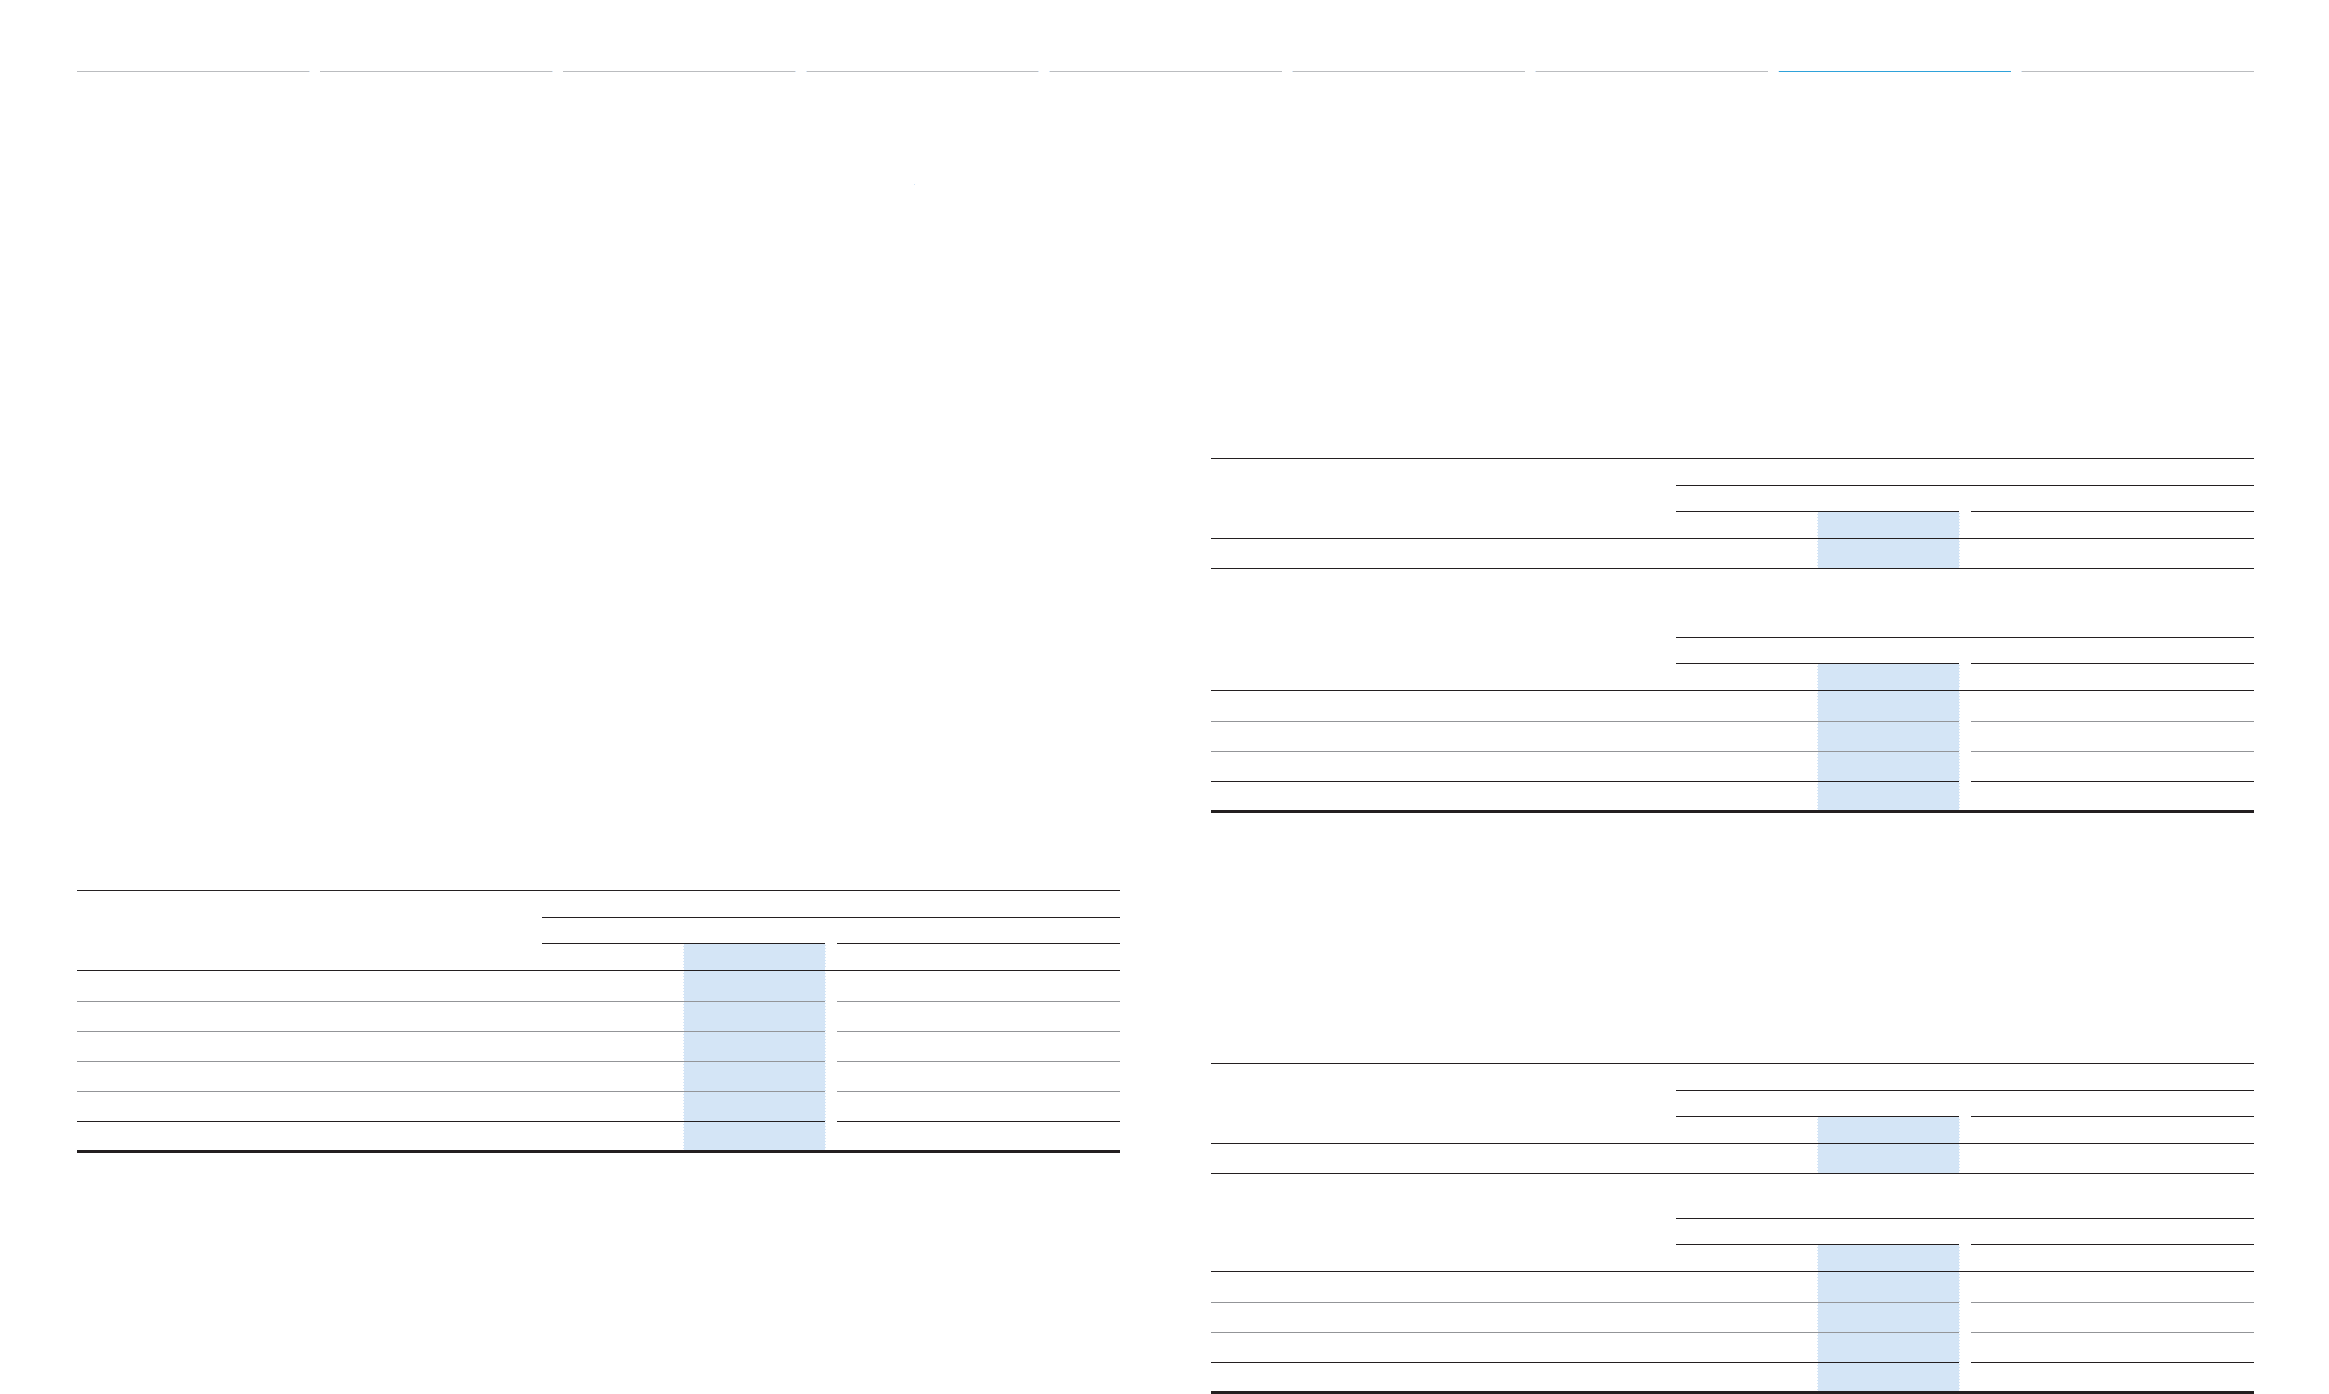
The following table shows the number of fi nancing contracts by geographic region at the end of the fi scal
2013 and 2012, respectively.
Number of fi nancing contracts in thousands
Years ended March 31, 2013 vs. 2012 Change
2012 2013 Amount Percentage (%)
Japan 1,697 1,765 68 +4.0
North America 4,535 4,596 61 +1.3
Europe 796 825 29 +3.7
Asia 649 868 219 +33.7
Other* 552 618 66 +11.9
Total 8,229 8,672 443 +5.4
* “Other” consists of Central and South America, Oceania and Africa.
Geographically, net revenues (before the elimina-
tion of intersegment revenues) for fi scal 2013
increased by 14.8% in Japan, 32.3% in North
America, 4.5% in Europe, 31.5% in Asia, and
19.0% in Other compared with the prior fi scal year.
Excluding the difference in the Japanese yen value
used for translation purposes of ¥281.8 billion, net
revenues in fi scal 2013 would have increased by
14.8% in Japan, 26.2% in North America, 6.9% in
Europe, 28.0% in Asia and 22.5% in Other com-
pared with the prior fi scal year.
The following is a discussion of net revenues in each geographic market (before the elimination of
intersegment revenues).
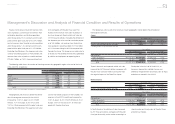
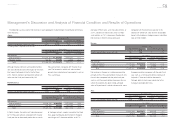
Japan
Thousands of units
Years ended March 31, 2013 vs. 2012 Change
2012 2013 Amount Percentage (%)
Toyota’s consolidated vehicle unit sales* 3,741 4,202 461 +12.3
* including number of exported vehicle unit sales
Yen in millions
Years ended March 31, 2013 vs. 2012 Change
2012 2013 Amount Percentage (%)
Net revenues:
Sales of products ¥11,040,964 ¥12,687,092 ¥1,646,128 +14.9
Financial services 126,355 133,926 7,571 +6.0
Total ¥11,167,319 ¥12,821,018 ¥1,653,699 +14.8
Toyota’s domestic and exported vehicle unit sales
increased by 461 thousand vehicles compared with
the prior fi scal year due mainly to a recovery from
the negative impact of the Great East Japan
Earthquake in the fi rst half of fi scal 2012, an
increase in demand by subsidies for eco-cars
offered by the government and strong sales of Aqua
and other car models in fi scal 2013.
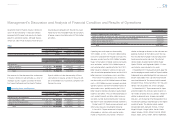
North America
Thousands of units
Years ended March 31, 2013 vs. 2012 Change
2012 2013 Amount Percentage (%)
Toyota’s consolidated vehicle unit sales 1,872 2,469 597 +31.9
Yen in millions
Years ended March 31, 2013 vs. 2012 Change
2012 2013 Amount Percentage (%)
Net revenues:
Sales of products ¥4,048,532 ¥5,564,183 ¥1,515,651 +37.4
Financial services 703,354 720,242 16,888 +2.4
Total ¥4,751,886 ¥6,284,425 ¥1,532,539 +32.3
In North America, the vehicle unit sales increased
by 597 thousand vehicles compared with the prior
fi scal year due mainly to the market recovering in a
steady manner and strong sales of Corolla, Camry
and other car models.
Management’s Discussion and Analysis of Financial Condition and Results of Operations
Selected Financial Summary (U.S. GAAP) Consolidated Segment Information Consolidated Quarterly Financial Summary Management’s Discussion and Analysis of Financial Condition and Results of Operations [6 of 26] Consolidated Financial Statements Notes to Consolidated Financial Statements
Management’s Annual Report on Internal Control over Financial Reporting Report of Independent Registered Public Accounting Firm