Toyota 2013 Annual Report Download - page 42
Download and view the complete annual report
Please find page 42 of the 2013 Toyota annual report below. You can navigate through the pages in the report by either clicking on the pages listed below, or by using the keyword search tool below to find specific information within the annual report.-
 1
1 -
2
-
3
-
4
-
5
-
6
-
7
-
8
-
9
-
10
-
11
-
12
-
13
-
14
-
15
-
16
-
17
-
18
-
19
-
20
-
21
-
22
-
23
-
24
-
25
-
26
-
27
-
28
-
29
-
30
-
31
-
 32
32 -
 33
33 -
 34
34 -
 35
35 -
 36
36 -
 37
37 -
 38
38 -
 39
39 -
 40
40 -
 41
41 -
 42
42 -
 43
43 -
 44
44 -
 45
45 -
 46
46 -
 47
47 -
 48
48 -
 49
49 -
 50
50 -
 51
51 -
 52
52 -
53
-
54
-
55
-
56
-
57
-
58
-
59
-
60
-
61
-
62
-
63
-
64
-
65
-
66
-
67
-
68
-
69
-
70
-
71
-
72
-
73
-
74
-
75
-
76
-
77
-
78
-
79
-
80
-
81
-
82
-
83
-
84
-
85
-
86
-
87
-
88
-
89
-
90
-
91
-
92
-
93
-
94
-
95
-
96
-
97
-
98
-
99
-
100
-
101
-
102
-
103
-
104
-
105
-
106
-
107
-
108
-
109
-
110
-
111
-
112
-
113
-
114
-
115
-
116
-
117
-
118
-
119
-
120
-
121
-
122
-
123
-
124
 |
 |
Toyota Global Vision President’s Message Launching a New Structure Special Feature Review of Operations
Consolidated Performance
Highlights
Management and
Corporate Information Investor InformationFinancial Section
Page 42
NextPrev
ContentsSearchPrint
ANNUAL REPORT 2013
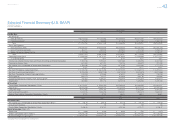
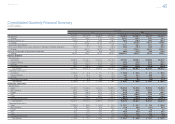
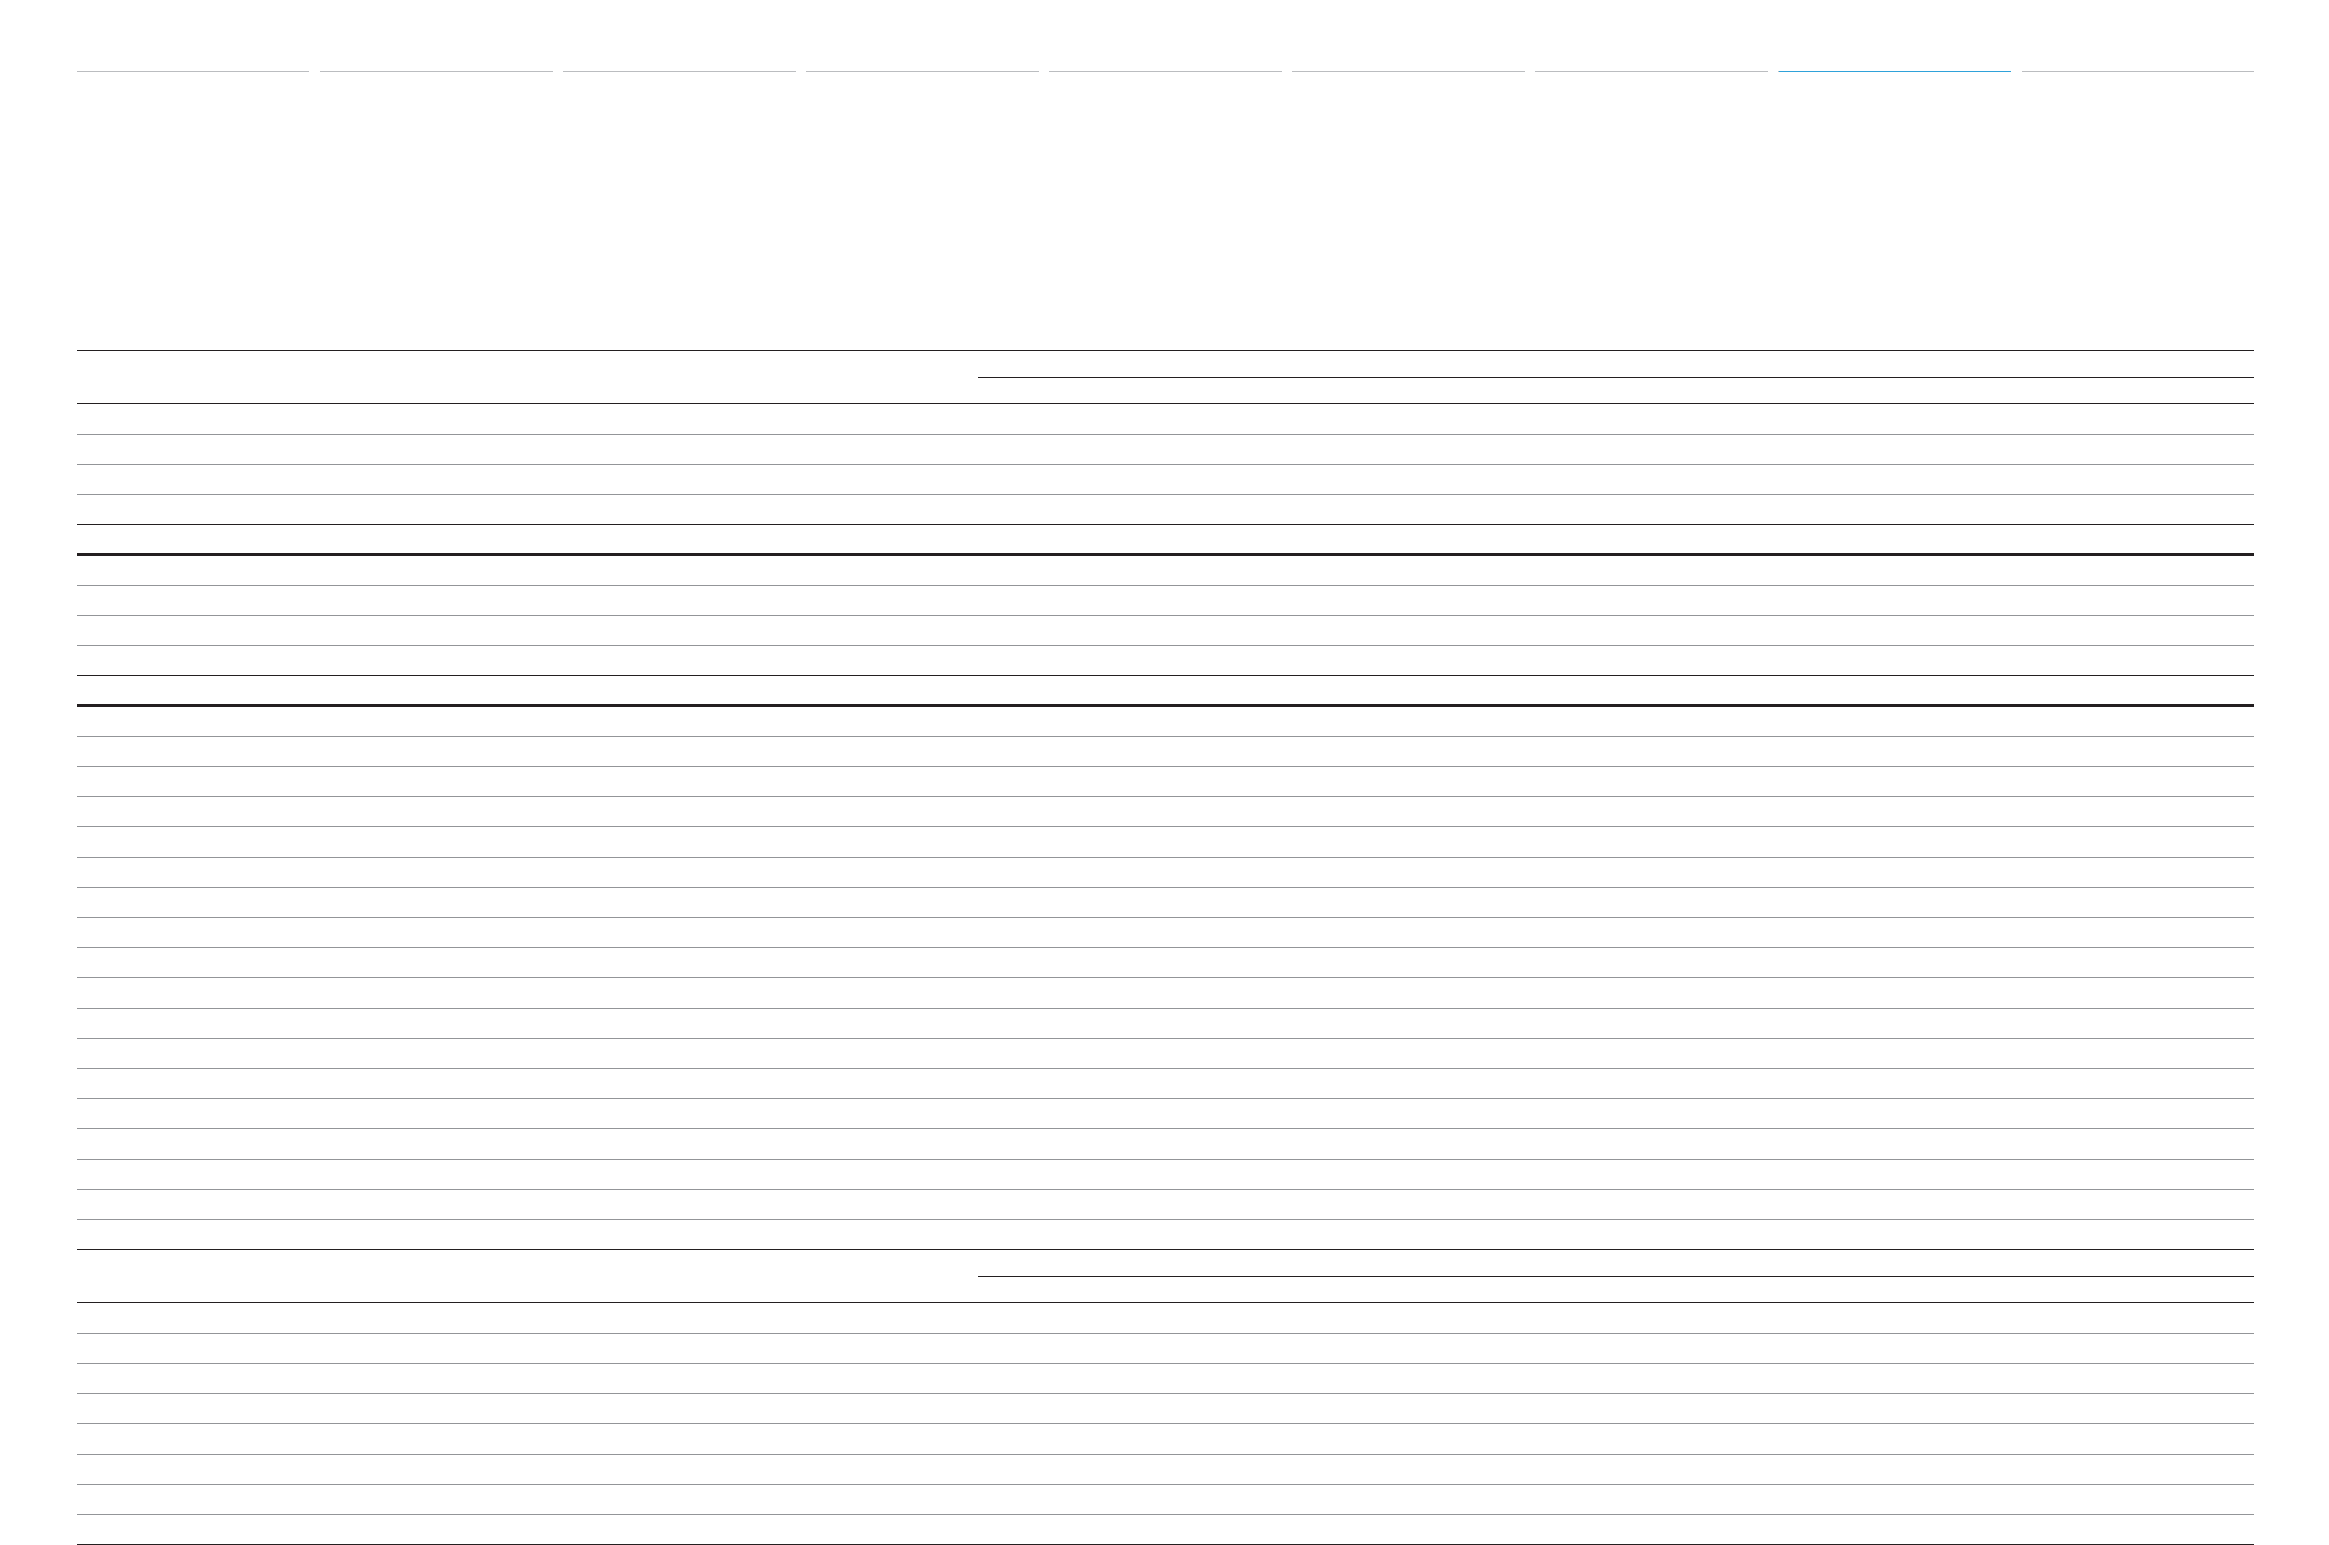
Yen in millions
2004 2005 2006 2007 2008
For the Year:
Net Revenues:
Sales of Products ¥16,578,033 ¥17,790,862 ¥20,059,493 ¥22,670,097 ¥24,820,510
Financing Operations 716,727 760,664 977,416 1,277,994 1,468,730
Total ¥17,294,760 ¥18,551,526 ¥21,036,909 ¥23,948,091 ¥26,289,240
Costs and Expenses:
Cost of Products Sold ¥13,506,337 ¥14,500,282 ¥16,335,312 ¥18,356,255 ¥20,452,338
Cost of Financing Operations 364,177 369,844 609,632 872,138 1,068,015
Selling, General and Administrative 1,757,356 2,009,213 2,213,623 2,481,015 2,498,512
Total ¥15,627,870 ¥16,879,339 ¥19,158,567 ¥21,709,408 ¥24,018,865
Operating Income (Loss) ¥ 1,666,890 ¥ 1,672,187 ¥ 1,878,342 ¥ 2,238,683 ¥ 2,270,375
% of Net Revenues 9.6% 9.0% 8.9% 9.3% 8.6%
Income (Loss) before Income Taxes and Equity in Earnings of Affi liated Companies 1,765,793 1,754,637 2,087,360 2,382,516 2,437,222
Provision for Income Taxes 681,304 657,910 795,153 898,312 911,495
Net Income (Loss) Attributable to Toyota Motor Corporation 1,162,098 1,171,260 1,372,180 1,644,032 1,717,879
ROE 15.2% 13.6% 14.0% 14.7% 14.5%
Net Cash Provided by Operating Activities ¥ 2,186,734 ¥ 2,370,940 ¥ 2,515,480 ¥ 3,238,173 ¥ 2,981,624
Net Cash Used in Investing Activities (2,216,495) (3,061,196) (3,375,500) (3,814,378) (3,874,886)
Net Cash Provided by (Used in) Financing Activities 242,223 419,384 876,911 881,768 706,189
R&D Expenses 682,279 755,147 812,648 890,782 958,882
Capital Expenditures for Property, Plant and Equipment* 945,803 1,068,287 1,523,459 1,425,814 1,480,570
Depreciation 969,904 997,713 1,211,178 1,382,594 1,491,135
At Year-End:
Toyota Motor Corporation Shareholders’ Equity ¥ 8,178,567 ¥ 9,044,950 ¥10,560,449 ¥11,836,092 ¥11,869,527
Total Assets 22,040,228 24,335,011 28,731,595 32,574,779 32,458,320
Long-Term Debt 4,247,266 5,014,925 5,640,490 6,263,585 5,981,931
Cash and Cash Equivalents 1,729,776 1,483,753 1,569,387 1,900,379 1,628,547
Ratio of Toyota Motor Corporation Shareholders’ Equity 37.1% 37.2% 36.8% 36.3% 36.6%
Yen
2004 2005 2006 2007 2008
Per Share Data:
Net Income (Loss) Attributable to Toyota Motor Corporation (Basic) ¥ 342.90 ¥ 355.35 ¥ 421.76 ¥ 512.09 ¥ 540.65
Annual Cash Dividends 45 65 90 120 140
Toyota Motor Corporation Shareholders’ Equity 2,456.08 2,767.67 3,257.63 3,701.17 3,768.97
Stock Information (March 31):
Stock Price ¥ 3,880 ¥ 3,990 ¥ 6,430 ¥ 7,550 ¥ 4,970
Market Capitalization (Yen in millions) ¥14,006,790 ¥14,403,890 ¥23,212,284 ¥27,255,481 ¥17,136,548
Number of Shares Issued (shares) 3,609,997,492 3,609,997,492 3,609,997,492 3,609,997,492 3,447,997,492
* Excluding vehicles and equipment of operating leases
Selected Financial Summary (U.S. GAAP)
Toyota Motor Corporation
Fiscal years ended March 31
Selected Financial Summary (U.S. GAAP) [1 of 2] Consolidated Segment Information Consolidated Quarterly Financial Summary Management’s Discussion and Analysis of Financial Condition and Results of Operations Consolidated Financial Statements Notes to Consolidated Financial Statements
Management’s Annual Report on Internal Control over Financial Reporting Report of Independent Registered Public Accounting Firm