Toyota 2013 Annual Report Download - page 106
Download and view the complete annual report
Please find page 106 of the 2013 Toyota annual report below. You can navigate through the pages in the report by either clicking on the pages listed below, or by using the keyword search tool below to find specific information within the annual report.-
 1
1 -
2
-
3
-
4
-
5
-
6
-
7
-
8
-
9
-
10
-
11
-
12
-
13
-
14
-
15
-
16
-
17
-
18
-
19
-
20
-
21
-
22
-
23
-
24
-
25
-
26
-
27
-
28
-
29
-
30
-
31
-
32
-
33
-
34
-
35
-
36
-
37
-
38
-
39
-
40
-
41
-
42
-
43
-
44
-
45
-
46
-
47
-
48
-
49
-
50
-
51
-
52
-
53
-
54
-
55
-
56
-
57
-
58
-
59
-
60
-
61
-
62
-
63
-
64
-
65
-
66
-
67
-
68
-
69
-
70
-
71
-
72
-
73
-
74
-
75
-
76
-
77
-
78
-
79
-
80
-
81
-
82
-
83
-
84
-
85
-
86
-
87
-
88
-
89
-
90
-
91
-
92
-
93
-
94
-
95
-
 96
96 -
 97
97 -
 98
98 -
 99
99 -
 100
100 -
 101
101 -
 102
102 -
 103
103 -
 104
104 -
 105
105 -
 106
106 -
 107
107 -
 108
108 -
 109
109 -
 110
110 -
 111
111 -
 112
112 -
 113
113 -
 114
114 -
 115
115 -
 116
116 -
117
-
118
-
119
-
120
-
121
-
122
-
123
-
124
 |
 |

Toyota Global Vision President’s Message Launching a New Structure Special Feature Review of Operations
Consolidated Performance
Highlights
Management and
Corporate Information Investor InformationFinancial Section
Page 106
NextPrev
ContentsSearchPrint
ANNUAL REPORT 2013
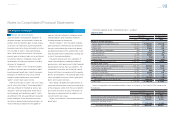
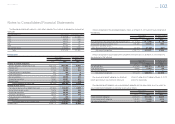
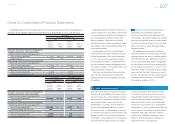
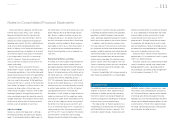
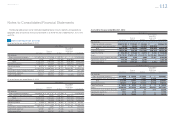
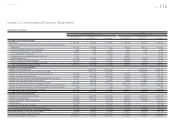
Fair value and gains or losses on derivative fi nancial instruments
The following table summarizes the fair values of derivative fi nancial instruments as of March 31, 2012 and 2013:
Yen in millions U.S. dollars in millions
March 31, March 31,
2012 2013 2013
Derivative fi nancial instruments designated as
hedging instruments:
Interest rate and currency swap agreements
Prepaid expenses and other current assets ¥ 7,166 ¥ 10,769 $ 114
Investments and other assets—Other 61,174 39,569 421
Total ¥ 68,340 ¥ 50,338 $ 535
Other current liabilities ¥ (2,060) ¥ (2,554) $ (27)
Other long-term liabilities (303) (143) (2)
Total ¥ (2,363) ¥ (2,697) $ (29)
Undesignated derivative fi nancial instruments:
Interest rate and currency swap agreements
Prepaid expenses and other current assets ¥ 61,983 ¥ 27,731 $ 295
Investments and other assets—Other 157,642 139,419 1,482
Total ¥ 219,625 ¥ 167,150 $ 1,777
Other current liabilities ¥ (38,338) ¥ (37,133) $ (395)
Other long-term liabilities (120,666) (122,420) (1,301)
Total ¥(159,004) ¥(159,553) $(1,696)
Foreign exchange forward and option contracts
Prepaid expenses and other current assets ¥ 9,531 ¥ 7,340 $ 78
Investments and other assets—Other — ——
Total ¥ 9,531 ¥ 7,340 $ 78
Other current liabilities ¥ (21,736) ¥ (36,087) $ (384)
Other long-term liabilities (70) (5) (0)
Total ¥ (21,806) ¥ (36,092) $ (384)
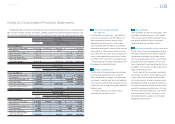
As of March 31, 2012 and 2013, the amounts of
counterparty netting and cash collateral received
that partially offset derivative assets were ¥218,509
million and ¥158,807 million ($1,689 million),
respectively. The amounts of counterparty netting
and cash collateral pledged that partially offset
derivative liabilities were ¥(90,963) million and
¥(86,477) million ($(919) million), respectively. These
amounts included in the above table were offset in
the consolidated balance sheets.
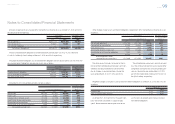
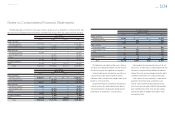
The following table summarizes the notional amounts of derivative fi nancial instruments as of March 31,
2012 and 2013:
Yen in millions U.S. dollars in millions
March 31, March 31,
2012 2013 2013
Designated
derivative
fi nancial
instruments
Undesignated
derivative
fi nancial
instruments
Designated
derivative
fi nancial
instruments
Undesignated
derivative
fi nancial
instruments
Designated
derivative
fi nancial
instruments
Undesignated
derivative
fi nancial
instruments
Interest rate and currency
swap agreements ¥344,623 ¥10,607,666 ¥235,219 ¥12,689,774 $2,501 $134,926
Foreign exchange forward
and option contracts — 2,199,627 — 2,104,048 — 22,371
Total ¥344,623 ¥12,807,293 ¥235,219 ¥14,793,822 $2,501 $157,297
Undesignated derivative fi nancial instruments
Toyota uses foreign exchange forward contracts,
foreign currency options, interest rate swaps, inter-
est rate currency swap agreements, and interest
rate options, to manage its exposure to foreign
currency exchange rate fl uctuations and interest
rate fl uctuations from an economic perspective, and
for which Toyota is unable or has elected not to
apply hedge accounting.
Notes to Consolidated Financial Statements
Selected Financial Summary (U.S. GAAP) Consolidated Segment Information Consolidated Quarterly Financial Summary Management’s Discussion and Analysis of Financial Condition and Results of Operations Consolidated Financial Statements Notes to Consolidated Financial Statements [29 of 44]
Management’s Annual Report on Internal Control over Financial Reporting Report of Independent Registered Public Accounting Firm