Toyota 2013 Annual Report Download - page 46
Download and view the complete annual report
Please find page 46 of the 2013 Toyota annual report below. You can navigate through the pages in the report by either clicking on the pages listed below, or by using the keyword search tool below to find specific information within the annual report.-
 1
1 -
2
-
3
-
4
-
5
-
6
-
7
-
8
-
9
-
10
-
11
-
12
-
13
-
14
-
15
-
16
-
17
-
18
-
19
-
20
-
21
-
22
-
23
-
24
-
25
-
26
-
27
-
28
-
29
-
30
-
31
-
32
-
33
-
34
-
35
-
 36
36 -
 37
37 -
 38
38 -
 39
39 -
 40
40 -
 41
41 -
 42
42 -
 43
43 -
 44
44 -
 45
45 -
 46
46 -
 47
47 -
 48
48 -
 49
49 -
 50
50 -
 51
51 -
 52
52 -
 53
53 -
 54
54 -
 55
55 -
 56
56 -
57
-
58
-
59
-
60
-
61
-
62
-
63
-
64
-
65
-
66
-
67
-
68
-
69
-
70
-
71
-
72
-
73
-
74
-
75
-
76
-
77
-
78
-
79
-
80
-
81
-
82
-
83
-
84
-
85
-
86
-
87
-
88
-
89
-
90
-
91
-
92
-
93
-
94
-
95
-
96
-
97
-
98
-
99
-
100
-
101
-
102
-
103
-
104
-
105
-
106
-
107
-
108
-
109
-
110
-
111
-
112
-
113
-
114
-
115
-
116
-
117
-
118
-
119
-
120
-
121
-
122
-
123
-
124
 |
 |

Toyota Global Vision President’s Message Launching a New Structure Special Feature Review of Operations
Consolidated Performance
Highlights
Management and
Corporate Information Investor InformationFinancial Section
Page 46
NextPrev
ContentsSearchPrint
ANNUAL REPORT 2013
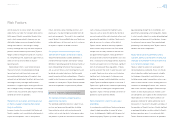
Toyota’s share of total vehicle unit sales in each
market is infl uenced by the quality, safety, reliability,
price, design, performance, economy and utility of
Toyota’s vehicles compared with those offered by
other manufacturers. The timely introduction of new
or redesigned vehicles is also an important factor in
satisfying customer needs. Toyota’s ability to satisfy
changing customer preferences can affect its reve-
nues and earnings signifi cantly.
The profi tability of Toyota’s automotive operations
is affected by many factors. These factors include:
• vehicle unit sales volumes,
• the mix of vehicle models and options sold,
• the level of parts and service sales,
• the levels of price discounts and other sales
incentives and marketing costs,
• the cost of customer warranty claims and other
customer satisfaction actions,
• the cost of research and development and
other fi xed costs,
• the prices of raw materials,
• the ability to control costs,
•
the effi cient use of production capacity,
•
the adverse effect on production due to the
reliance on various suppliers for the provision
of supplies,
• the adverse effect on market, sales and pro-
ductions of natural calamities and interruptions
of social infrastructure, and
• changes in the value of the Japanese yen and
other currencies in which Toyota conducts
business.
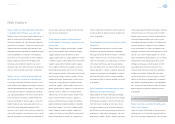
Management’s Discussion and Analysis of Financial Condition and Results of Operations
All fi nancial information discussed in this section is derived from Toyota’s consolidated
fi nancial statements that appear elsewhere in this annual report. The fi nancial statements
have been prepared in conformity with generally accepted accounting principles in the
United States of America.
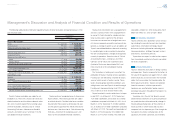
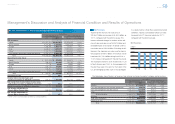
The following table sets forth Toyota’s consolidated vehicle unit sales by geographic market based on loca-
tion of customers for the past three fi scal years.
Thousands of units
Years Ended March 31,
2011 2012 2013
Japan 1,913 2,071 2,279
North America 2,031 1,872 2,469
Europe 796 798 799
Asia 1,255 1,327 1,684
Other* 1,313 1,284 1,640
Overseas total 5,395 5,281 6,592
Total 7,308 7,352 8,871
* “Other” consists of Central and South America, Oceania, Africa and the Middle East, etc.
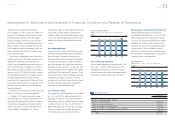
During fi scal 2013 and 2012, Toyota’s consolidat-
ed vehicle unit sales in Japan increased as com-
pared with each prior fi scal year, primarily as a result
of the active introduction of new products and the
efforts of dealers nationwide. Toyota and Lexus
brands’ market share excluding mini-vehicles was
48.4% for fi scal 2013, representing a record high,
and market share (including Daihatsu and Hino
brands) including mini-vehicles remained at a high
level of 44.3% following the prior fi scal year. Overseas
consolidated vehicle unit sales decreased during
fi scal 2012, whereas they increased during fi scal
2013. During fi scal 2012, total overseas vehicle unit
sales decreased, particularly in North America due
to impact of the Great East Japan Earthquake and
the fl ood in Thailand, although an increase in Asia
resulted from steady demand in spite of the fl ood in
Thailand. During fi scal 2013, total overseas vehicle
unit sales increased in every region.
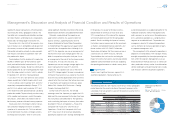
10,000
0
8,000
6,000
4,000
2,000
FY
Consolidated Vehicle Sales
(Thousands of units)
’09 ’10 ’11 ’12 ’13
The business segments of Toyota include auto-
motive operations, fi nancial services operations
and all other operations. Automotive operations
are Toyota’s most signifi cant business segment,
accounting for 90% of Toyota’s total revenues
before the elimination of intersegment revenues for
fi scal 2013. Toyota’s primary markets based on
vehicle unit sales for fi scal 2013 were: Japan (26%),
North America (28%), Europe (9%) and Asia (19%).
Automotive Market Environment
The worldwide automotive market is highly competi-
tive and volatile. The demand for automobiles is
affected by a number of factors including social,
political and general economic conditions; introduc-
tion of new vehicles and technologies; and costs
incurred by customers to purchase or operate vehi-
cles. These factors can cause consumer demand to
vary substantially in different geographic markets
and for different types of automobiles.
For the automobile industry, markets have pro-
gressed in a steady manner, especially in the U.S.
and emerging countries such as Asia. The demand
for products with advanced green technology has
remained strong throughout all markets worldwide.
Overview
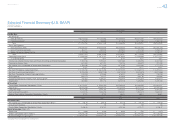
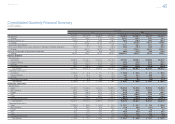
Selected Financial Summary (U.S. GAAP) Consolidated Segment Information Consolidated Quarterly Financial Summary Management’s Discussion and Analysis of Financial Condition and Results of Operations [1 of 26] Consolidated Financial Statements Notes to Consolidated Financial Statements
Management’s Annual Report on Internal Control over Financial Reporting Report of Independent Registered Public Accounting Firm