Toyota 2013 Annual Report Download - page 114
Download and view the complete annual report
Please find page 114 of the 2013 Toyota annual report below. You can navigate through the pages in the report by either clicking on the pages listed below, or by using the keyword search tool below to find specific information within the annual report.-
 1
1 -
2
-
3
-
4
-
5
-
6
-
7
-
8
-
9
-
10
-
11
-
12
-
13
-
14
-
15
-
16
-
17
-
18
-
19
-
20
-
21
-
22
-
23
-
24
-
25
-
26
-
27
-
28
-
29
-
30
-
31
-
32
-
33
-
34
-
35
-
36
-
37
-
38
-
39
-
40
-
41
-
42
-
43
-
44
-
45
-
46
-
47
-
48
-
49
-
50
-
51
-
52
-
53
-
54
-
55
-
56
-
57
-
58
-
59
-
60
-
61
-
62
-
63
-
64
-
65
-
66
-
67
-
68
-
69
-
70
-
71
-
72
-
73
-
74
-
75
-
76
-
77
-
78
-
79
-
80
-
81
-
82
-
83
-
84
-
85
-
86
-
87
-
88
-
89
-
90
-
91
-
92
-
93
-
94
-
95
-
96
-
97
-
98
-
99
-
100
-
101
-
102
-
103
-
 104
104 -
 105
105 -
 106
106 -
 107
107 -
 108
108 -
 109
109 -
 110
110 -
 111
111 -
 112
112 -
 113
113 -
 114
114 -
 115
115 -
 116
116 -
 117
117 -
 118
118 -
 119
119 -
 120
120 -
 121
121 -
 122
122 -
 123
123 -
 124
124
 |
 |
Toyota Global Vision President’s Message Launching a New Structure Special Feature Review of Operations
Consolidated Performance
Highlights
Management and
Corporate Information Investor InformationFinancial Section
Page 114
NextPrev
ContentsSearchPrint
ANNUAL REPORT 2013
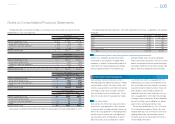
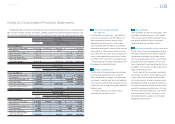
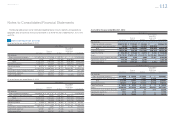
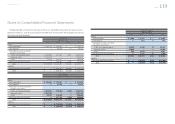
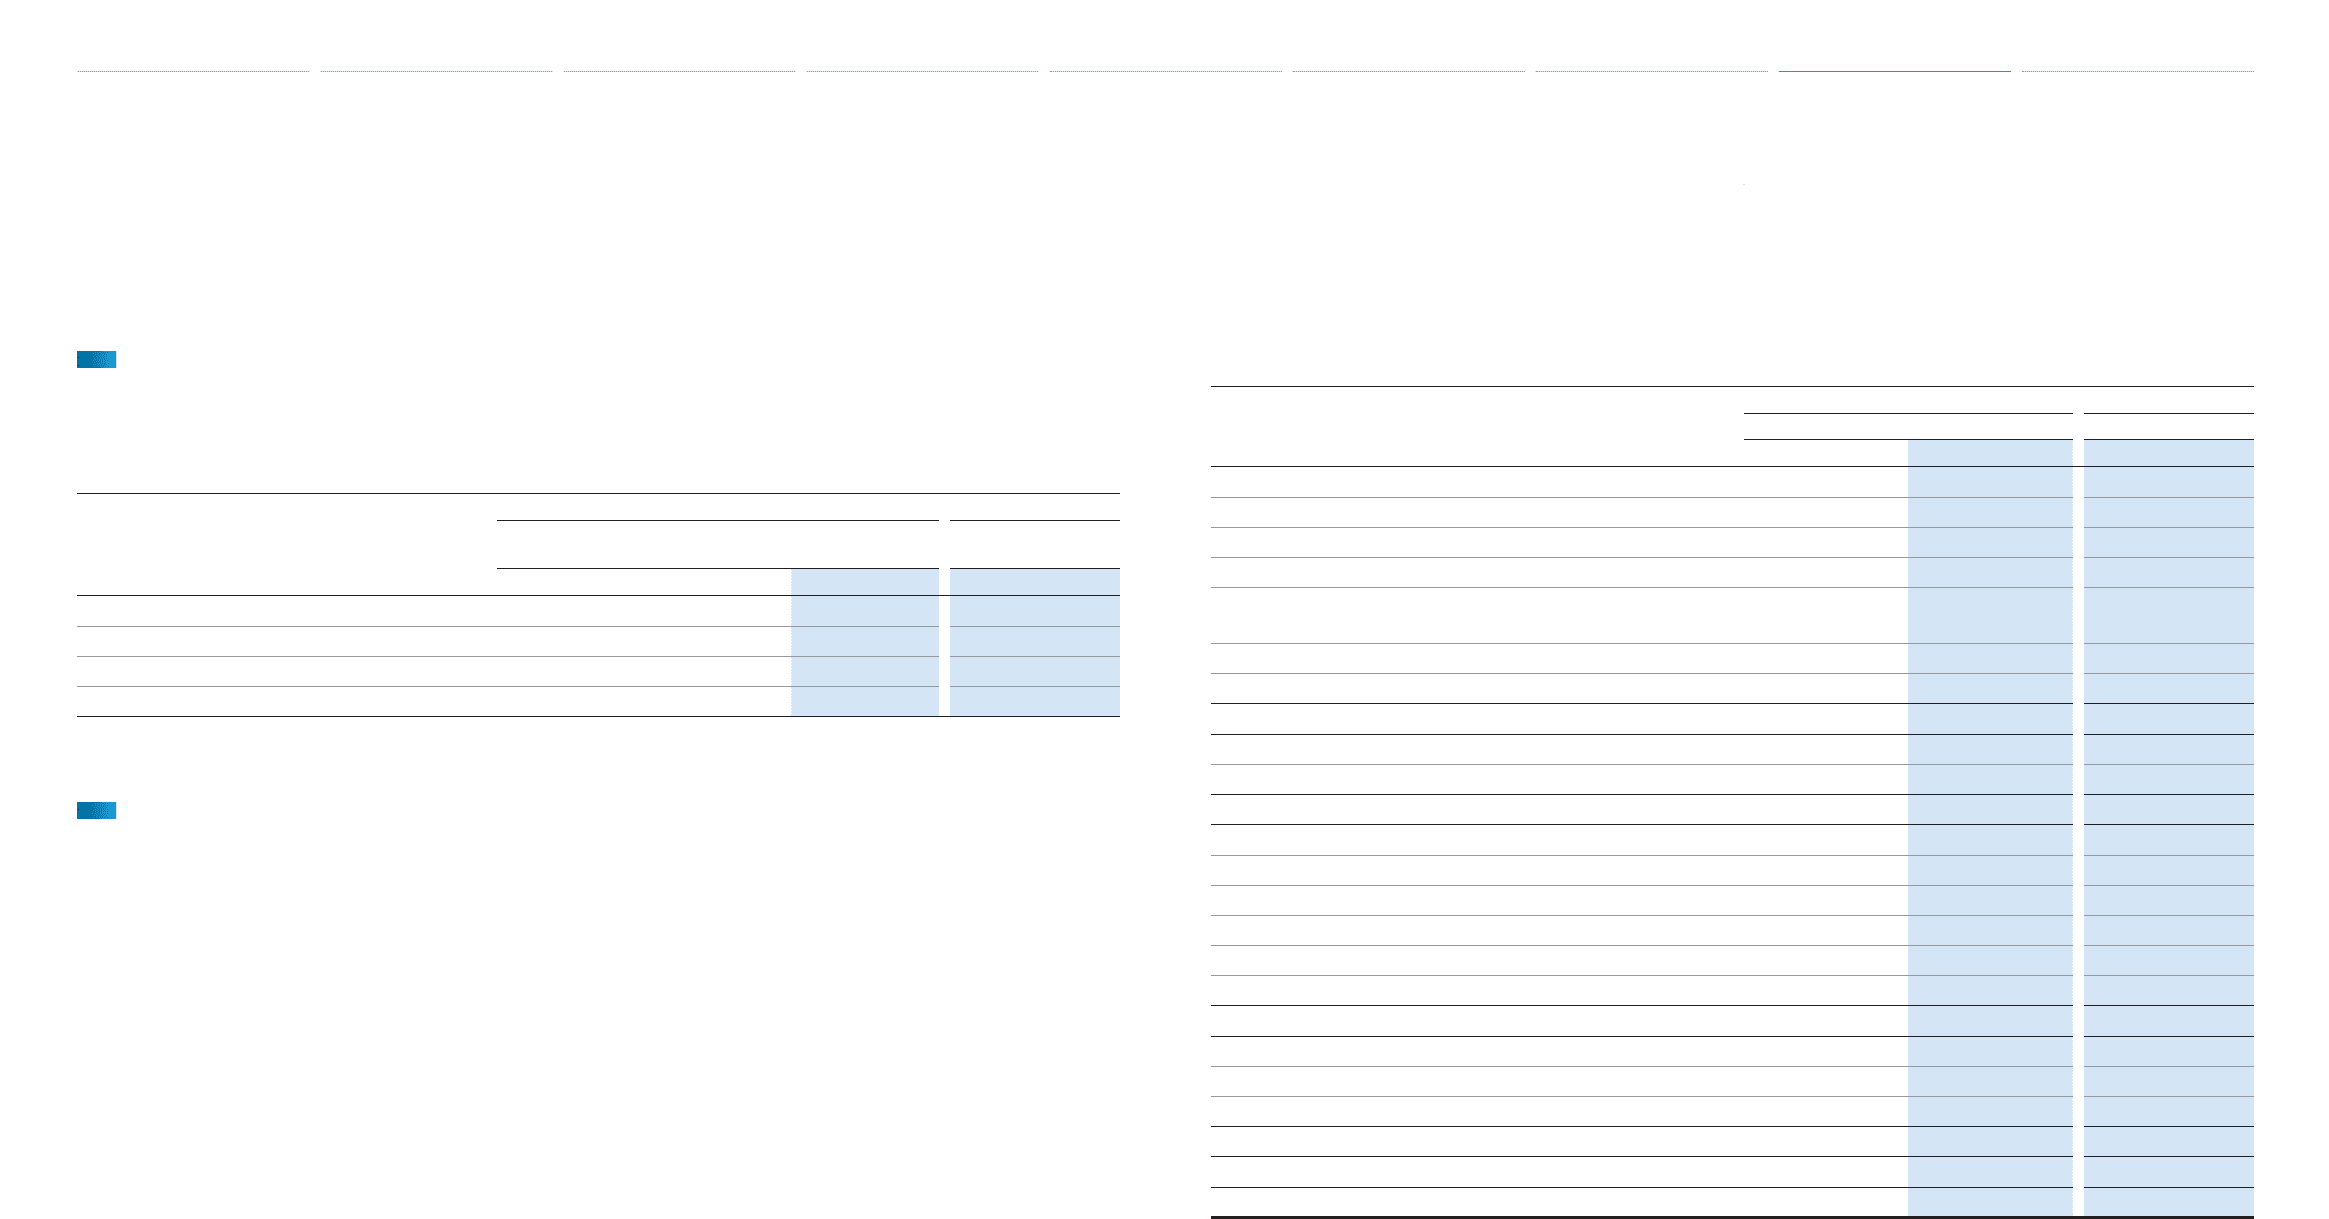
Overseas Revenues by destination
The following information shows revenues that are
attributed to countries based on location of custom-
ers, excluding customers in Japan. In addition to
the disclosure requirements under U.S. GAAP,
Toyota discloses this information in order to provide
fi nancial statements users with valuable information.
Yen in millions U.S. dollars in millions
For the years ended March 31,
For the year ended
March 31,
2011 2012 2013 2013
North America ¥5,398,278 ¥4,715,804 ¥6,790,453 $72,200
Europe 1,793,932 1,817,944 1,901,118 20,214
Asia 3,280,384 3,284,392 3,940,175 41,894
Other 3,196,114 3,103,383 3,929,775 41,784
“Other” consists of Central and South America, Oceania, Africa and the Middle East, etc.
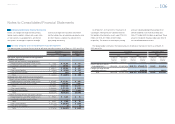
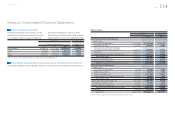
Certain fi nancial statements data on non-fi nancial services and fi nancial services businesses
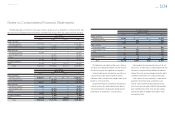
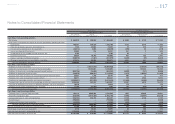
The fi nancial data below presents separately Toyota’s non-fi nancial services and fi nancial services businesses.
Balance sheets
Yen in millions U.S. dollars in millions
March 31, March 31,
2012 2013 2013
Non-Financial Services Businesses
Current assets
Cash and cash equivalents ¥ 1,104,636 ¥ 1,107,409 $ 11,775
Marketable securities 1,015,626 1,204,447 12,806
Trade accounts and notes receivable,
less allowance for doubtful accounts 2,031,472 2,033,831 21,625
Inventories 1,622,154 1,715,634 18,242
Prepaid expenses and other current assets 1,464,124 1,597,514 16,986
Total current assets 7,238,012 7,658,835 81,434
Investments and other assets 6,218,377 7,462,767 79,349
Property, plant and equipment 4,510,716 4,741,357 50,413
Total Non-Financial Services Businesses assets 17,967,105 19,862,959 211,196
Financial Services Businesses
Current assets
Cash and cash equivalents 574,564 610,888 6,495
Marketable securities 165,444 241,216 2,565
Finance receivables, net 4,114,897 5,117,660 54,414
Prepaid expenses and other current assets 685,611 693,036 7,369
Total current assets 5,540,516 6,662,800 70,843
Noncurrent fi nance receivables, net 5,602,462 6,943,766 73,830
Investments and other assets 304,906 515,025 5,476
Property, plant and equipment 1,724,664 2,109,882 22,434
Total Financial Services Businesses assets 13,172,548 16,231,473 172,583
Eliminations (488,688) (611,115) (6,498)
Total assets ¥30,650,965 ¥35,483,317 $377,281
* Assets in the non-fi nancial services include unallocated corporate assets.
Notes to Consolidated Financial Statements
Selected Financial Summary (U.S. GAAP) Consolidated Segment Information Consolidated Quarterly Financial Summary Management’s Discussion and Analysis of Financial Condition and Results of Operations Consolidated Financial Statements Notes to Consolidated Financial Statements [37 of 44]
Management’s Annual Report on Internal Control over Financial Reporting Report of Independent Registered Public Accounting Firm