Toyota 2013 Annual Report Download - page 89
Download and view the complete annual report
Please find page 89 of the 2013 Toyota annual report below. You can navigate through the pages in the report by either clicking on the pages listed below, or by using the keyword search tool below to find specific information within the annual report.-
 1
1 -
2
-
3
-
4
-
5
-
6
-
7
-
8
-
9
-
10
-
11
-
12
-
13
-
14
-
15
-
16
-
17
-
18
-
19
-
20
-
21
-
22
-
23
-
24
-
25
-
26
-
27
-
28
-
29
-
30
-
31
-
32
-
33
-
34
-
35
-
36
-
37
-
38
-
39
-
40
-
41
-
42
-
43
-
44
-
45
-
46
-
47
-
48
-
49
-
50
-
51
-
52
-
53
-
54
-
55
-
56
-
57
-
58
-
59
-
60
-
61
-
62
-
63
-
64
-
65
-
66
-
67
-
68
-
69
-
70
-
71
-
72
-
73
-
74
-
75
-
76
-
77
-
78
-
 79
79 -
 80
80 -
 81
81 -
 82
82 -
 83
83 -
 84
84 -
 85
85 -
 86
86 -
 87
87 -
 88
88 -
 89
89 -
 90
90 -
 91
91 -
 92
92 -
 93
93 -
 94
94 -
 95
95 -
 96
96 -
 97
97 -
 98
98 -
 99
99 -
100
-
101
-
102
-
103
-
104
-
105
-
106
-
107
-
108
-
109
-
110
-
111
-
112
-
113
-
114
-
115
-
116
-
117
-
118
-
119
-
120
-
121
-
122
-
123
-
124
 |
 |

Toyota Global Vision President’s Message Launching a New Structure Special Feature Review of Operations
Consolidated Performance
Highlights
Management and
Corporate Information Investor InformationFinancial Section
Page 89
NextPrev
ContentsSearchPrint
ANNUAL REPORT 2013
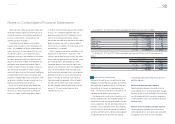
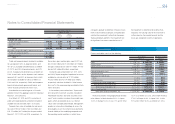
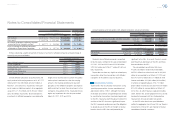
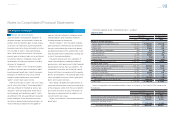
An analysis of the allowance for credit losses relating to fi nance receivables and vehicles and equipment on
operating leases for the years ended March 31, 2011, 2012 and 2013 is as follows:
Yen in millions U.S. dollars in millions
For the years ended March 31,
For the year ended
March 31,
2011 2012 2013 2013
Allowance for credit losses at beginning of year ¥232,479 ¥167,615 ¥140,363 $1,493
Provision for credit losses, net of reversal 2,334 3,780 25,622 272
Charge-offs (86,115) (51,578) (56,701) (603)
Recoveries 18,268 16,415 14,690 156
Other 649 4,131 23,075 246
Allowance for credit losses at end of year ¥167,615 ¥140,363 ¥147,049 $1,564
The other amount primarily includes the impact of currency translation adjustments for the years ended
March 31, 2011, 2012 and 2013.
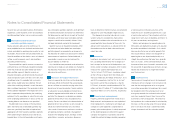
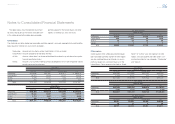
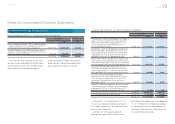
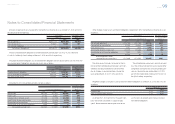
An analysis of the allowance for credit losses above relating to retail receivables portfolio segment, fi nance
lease receivables portfolio segment and wholesale and other dealer loan receivables portfolio segment for the
years ended March 31, 2012 and 2013 are as follows:
Yen in millions
For the year ended March 31, 2012
Retail Finance leases
Wholesale and
Other dealer loans
Allowance for credit losses at beginning of year ¥92,199 ¥36,024 ¥28,580
Provision for credit losses, net of reversal 13,569 (4,508) (4,767)
Charge-offs (44,742) (2,499) (305)
Recoveries 14,051 718 16
Other 2,276 902 714
Allowance for credit losses at end of year ¥77,353 ¥30,637 ¥24,238
Yen in millions
For the year ended March 31, 2013
Retail Finance leases
Wholesale and
Other dealer loans
Allowance for credit losses at beginning of year ¥77,353 ¥30,637 ¥24,238
Provision for credit losses, net of reversal 29,079 (4,063) (2,006)
Charge-offs (48,528) (2,775) (110)
Recoveries 12,795 590 3
Other 13,159 4,539 4,118
Allowance for credit losses at end of year ¥83,858 ¥28,928 ¥26,243
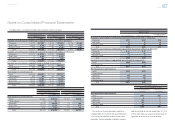
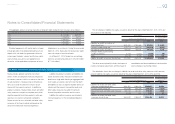
U.S. dollars in millions
For the year ended March 31, 2013
Retail Finance leases
Wholesale and
Other dealer loans
Allowance for credit losses at beginning of year $823 $326 $257
Provision for credit losses, net of reversal 309 (43) (21)
Charge-offs (516) (30) (1)
Recoveries 136 6 0
Other 140 48 44
Allowance for credit losses at end of year $892 $307 $279
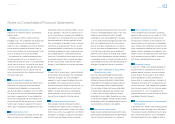
Investments in and transactions with affi liated companies
Summarized fi nancial information for affi liated companies accounted for by the equity method is shown below:
Yen in millions U.S. dollars in millions
March 31, March 31,
2012 2013 2013
Current assets ¥ 9,112,895 ¥ 9,634,769 $102,443
Noncurrent assets 6,914,208 8,495,078 90,325
Total assets ¥16,027,103 ¥18,129,847 $192,768
Current liabilities ¥ 5,847,495 ¥ 6,366,002 $ 67,687
Long-term liabilities and noncontrolling interests 4,032,045 4,541,328 48,286
Affi liated companies accounted for by the equity
method shareholders’ equity 6,147,563 7,222,517 76,795
Total liabilities and shareholders’ equity ¥16,027,103 ¥18,129,847 $192,768
Toyota’s share of affi liated companies accounted for by
the equity method shareholders’ equity ¥ 1,914,129 ¥ 2,102,584 $ 22,356
Number of affi liated companies accounted for by
the equity method at end of period 57 56
12. Affi liated companies and variable interest entities
Notes to Consolidated Financial Statements
Selected Financial Summary (U.S. GAAP) Consolidated Segment Information Consolidated Quarterly Financial Summary Management’s Discussion and Analysis of Financial Condition and Results of Operations Consolidated Financial Statements Notes to Consolidated Financial Statements [12 of 44]
Management’s Annual Report on Internal Control over Financial Reporting Report of Independent Registered Public Accounting Firm