Toyota 2013 Annual Report Download - page 70
Download and view the complete annual report
Please find page 70 of the 2013 Toyota annual report below. You can navigate through the pages in the report by either clicking on the pages listed below, or by using the keyword search tool below to find specific information within the annual report.-
 1
1 -
2
-
3
-
4
-
5
-
6
-
7
-
8
-
9
-
10
-
11
-
12
-
13
-
14
-
15
-
16
-
17
-
18
-
19
-
20
-
21
-
22
-
23
-
24
-
25
-
26
-
27
-
28
-
29
-
30
-
31
-
32
-
33
-
34
-
35
-
36
-
37
-
38
-
39
-
40
-
41
-
42
-
43
-
44
-
45
-
46
-
47
-
48
-
49
-
50
-
51
-
52
-
53
-
54
-
55
-
56
-
57
-
58
-
59
-
 60
60 -
 61
61 -
 62
62 -
 63
63 -
 64
64 -
 65
65 -
 66
66 -
 67
67 -
 68
68 -
 69
69 -
 70
70 -
 71
71 -
 72
72 -
 73
73 -
 74
74 -
 75
75 -
 76
76 -
 77
77 -
 78
78 -
 79
79 -
 80
80 -
81
-
82
-
83
-
84
-
85
-
86
-
87
-
88
-
89
-
90
-
91
-
92
-
93
-
94
-
95
-
96
-
97
-
98
-
99
-
100
-
101
-
102
-
103
-
104
-
105
-
106
-
107
-
108
-
109
-
110
-
111
-
112
-
113
-
114
-
115
-
116
-
117
-
118
-
119
-
120
-
121
-
122
-
123
-
124
 |
 |
Toyota Global Vision President’s Message Launching a New Structure Special Feature Review of Operations
Consolidated Performance
Highlights
Management and
Corporate Information Investor InformationFinancial Section
Page 70
NextPrev
ContentsSearchPrint
ANNUAL REPORT 2013
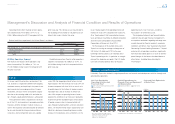
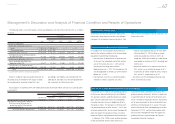
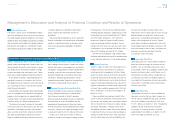
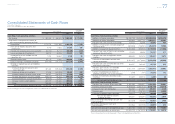
Sensitivity analysis
The following table illustrates the effect of an
assumed change in the vehicle return rate and end-
of-term market values mainly in the United States,
which Toyota believes are the critical estimates, in
determining the residual value losses, holding all
other assumptions constant. The following table
represents the impact on the residual value losses in
Toyota’s fi nancial services operations of the change
in vehicle return rate and end-of-term market values
as those changes have a signifi cant impact on
fi nancial services operations.
Yen in millions
Effect on the residual value losses over the remaining
terms of the operating leases on and after April 1, 2013
1 percent increase in vehicle return rate ¥1,035
1 percent increase in end-of-term market values 5,267
Impairment of Long-Lived Assets
Toyota periodically reviews the carrying value of its
long-lived assets held and used and assets to be
disposed of, including intangible assets, when events
and circumstances warrant such a review. This
review is performed using estimates of future cash
fl ows. If the carrying value of a long-lived asset is
considered impaired, an impairment charge is
recorded for the amount by which the carrying value
of the long-lived asset exceeds its fair value.
Management believes that the estimates of future
cash fl ows and fair values are reasonable. However,
changes in estimates of such cash fl ows and fair val-
ues would affect the evaluations and negatively affect
future operating results of the automotive operations.
Pension Costs and Obligations
Natures of estimates and assumptions
Pension costs and obligations are dependent on
assumptions used in calculating such amounts.
These assumptions include discount rates, benefi
ts
earned, interest costs, expected rate of return on
plan assets, mortality rates and other factors. Actual
results that differ from the assumptions are
accumulated and amortized over future periods
and, therefore, generally affect recognized expense
in future periods. While management believes that
the assumptions used are appropriate, differences
in actual experience or changes in assumptions
may affect Toyota’s pension costs and obligations.
The two most critical assumptions impacting the
calculation of pension costs and obligations are the
discount rates and the expected rates of returns on
plan assets. Toyota determines the discount rates
mainly based on the rates of high quality fi xed
income bonds or fi xed income governmental bonds
currently available and expected to be available dur-
ing the period to maturity of the defi ned benefi t pen-
sion plans. Toyota determines the expected rates of
return for pension assets after considering several
applicable factors including, the composition of plan
assets held, assumed risks of asset management,
historical results of the returns on plan assets,
Toyota’s principal policy for plan asset management,
and forecasted market conditions. A weighted-
average discount rate of 2.0% domestically and
5.0% overseas and a weighted-average expected
rate of return on plan assets of 2.5% domestically
Management’s Discussion and Analysis of Financial Condition and Results of Operations
and 7.0% overseas are the results of assumptions
used for the various pension plans in calculating
Toyota’s consolidated pension costs for fi scal 2013.
Also, a weighted-average discount rate of 1.7%
domestically and 4.5% overseas is the result of
assumption used for the various pension plans in
calculating Toyota’s consolidated pension obliga-
tions for fi scal 2013.
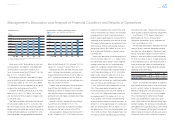
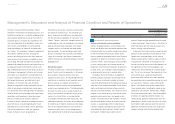
Sensitivity analysis
The following table illustrates the effects of assumed
changes in weighted-average discount rates and
the weighted-average expected rate of return on
plan assets, which Toyota believes are critical esti-
mates in determining pension costs and obligations,
assuming all other assumptions are consistent.
Yen in millions
Domestic Overseas
Effect on pre-tax
income for
the year ended
March 31, 2014
Effect on
obligations for
the year ended
March 31, 2013
Effect on pre-tax
income for
the year ended
March 31, 2014
Effect on
obligations for
the year ended
March 31, 2013
Discount rates
0.5% decrease ¥(7,217) ¥117,113 ¥(4,598) ¥57,956
0.5% increase 6,984 (108,417) 4,365 (52,908)
Expected rate of return on plan assets
0.5% decrease ¥(5,451) ¥(2,396)
0.5% increase 5,451 2,396
Derivatives and Other Contracts at
Fair Value
Toyota uses derivatives in the normal course of
business to manage its exposure to foreign curren-
cy exchange rates and interest rates. The account-
ing for derivatives is complex and continues to
evolve. Toyota estimates the fair value of derivative
fi nancial instruments using industry-standard valua-
tion models that require observable inputs including
interest rates and foreign exchange rates, and the
contractual terms. In other certain cases when mar-
ket data is not available, key inputs to the fair value
measurement include quotes from counterparties,
and other market data. These estimates are based
upon valuation methodologies deemed appropriate
under the circumstances. However, the use of
different assumptions may have a material effect on
the estimated fair value amounts.
Marketable Securities and Investments in
Affi liated Companies
Toyota’s accounting policy is to record a write-down
of such investments to net realizable value when a
decline in fair value below the carrying value is
other-than-temporary. In determining if a decline in
value is other-than-temporary, Toyota considers the
length of time and the extent to which the fair value
has been less than the carrying value, the fi nancial
condition and prospects of the company and
Toyota’s ability and intent to retain its investment in
the company for a period of time suffi cient to allow
for any anticipated recovery in fair value.
Selected Financial Summary (U.S. GAAP) Consolidated Segment Information Consolidated Quarterly Financial Summary Management’s Discussion and Analysis of Financial Condition and Results of Operations [25 of 26] Consolidated Financial Statements Notes to Consolidated Financial Statements
Management’s Annual Report on Internal Control over Financial Reporting Report of Independent Registered Public Accounting Firm