Toyota 2013 Annual Report Download - page 56
Download and view the complete annual report
Please find page 56 of the 2013 Toyota annual report below. You can navigate through the pages in the report by either clicking on the pages listed below, or by using the keyword search tool below to find specific information within the annual report.-
 1
1 -
2
-
3
-
4
-
5
-
6
-
7
-
8
-
9
-
10
-
11
-
12
-
13
-
14
-
15
-
16
-
17
-
18
-
19
-
20
-
21
-
22
-
23
-
24
-
25
-
26
-
27
-
28
-
29
-
30
-
31
-
32
-
33
-
34
-
35
-
36
-
37
-
38
-
39
-
40
-
41
-
42
-
43
-
44
-
45
-
 46
46 -
 47
47 -
 48
48 -
 49
49 -
 50
50 -
 51
51 -
 52
52 -
 53
53 -
 54
54 -
 55
55 -
 56
56 -
 57
57 -
 58
58 -
 59
59 -
 60
60 -
 61
61 -
 62
62 -
 63
63 -
 64
64 -
 65
65 -
 66
66 -
67
-
68
-
69
-
70
-
71
-
72
-
73
-
74
-
75
-
76
-
77
-
78
-
79
-
80
-
81
-
82
-
83
-
84
-
85
-
86
-
87
-
88
-
89
-
90
-
91
-
92
-
93
-
94
-
95
-
96
-
97
-
98
-
99
-
100
-
101
-
102
-
103
-
104
-
105
-
106
-
107
-
108
-
109
-
110
-
111
-
112
-
113
-
114
-
115
-
116
-
117
-
118
-
119
-
120
-
121
-
122
-
123
-
124
 |
 |
Toyota Global Vision President’s Message Launching a New Structure Special Feature Review of Operations
Consolidated Performance
Highlights
Management and
Corporate Information Investor InformationFinancial Section
Page 56
NextPrev
ContentsSearchPrint
ANNUAL REPORT 2013
¥150.0 billion favorable impact of changes in
exchange rates, the ¥645.0 billion of favorable
impact of changes in vehicle unit sales and sales
mix, and the ¥450.0 billion impact of cost reduction
efforts, partially offset by the ¥300.0 billion increase
in miscellaneous costs and others.
The changes in vehicle unit sales and changes in
sales mix was due primarily to the increase in
Toyota’s vehicle unit sales by 1,519 thousand vehi-
cles compared with the prior fi scal year resulting
from the increase in vehicle unit sales in every
region. The increase in miscellaneous costs and
others was due mainly to the ¥90.0 billion charge
for costs related to the settlement of the economic
loss claims in the consolidated federal action in the
U.S., the ¥70.0 billion increase in labor costs, the
¥50.0 billion impact of increase in product quality
related expenses and the ¥20.0 billion increase in
research and development expenses.
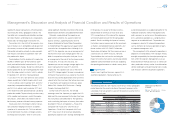
Financial Services Operations Segment
Net revenues for the fi nancial services operations
increased during fi
scal 2013 by ¥70.3 billion, or
6.4%, compared with the prior fi scal year to
¥1,170.6 billion. This increase was primarily due to
the ¥36.0 billion favorable impact of fl uctuations in
foreign currency translation rates and the ¥25.8 bil-
lion increase in rental income from vehicles and
equipment on operating leases.
Operating income from fi nancial services opera-
tions increased by ¥9.3 billion, or 3.1%, to ¥315.8
billion during fi scal 2013 compared with the prior
fi scal year. This increase was due primarily to the
recording of ¥12.9 billion of valuation gains on inter-
est rate swaps stated at fair value.
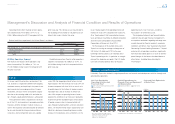
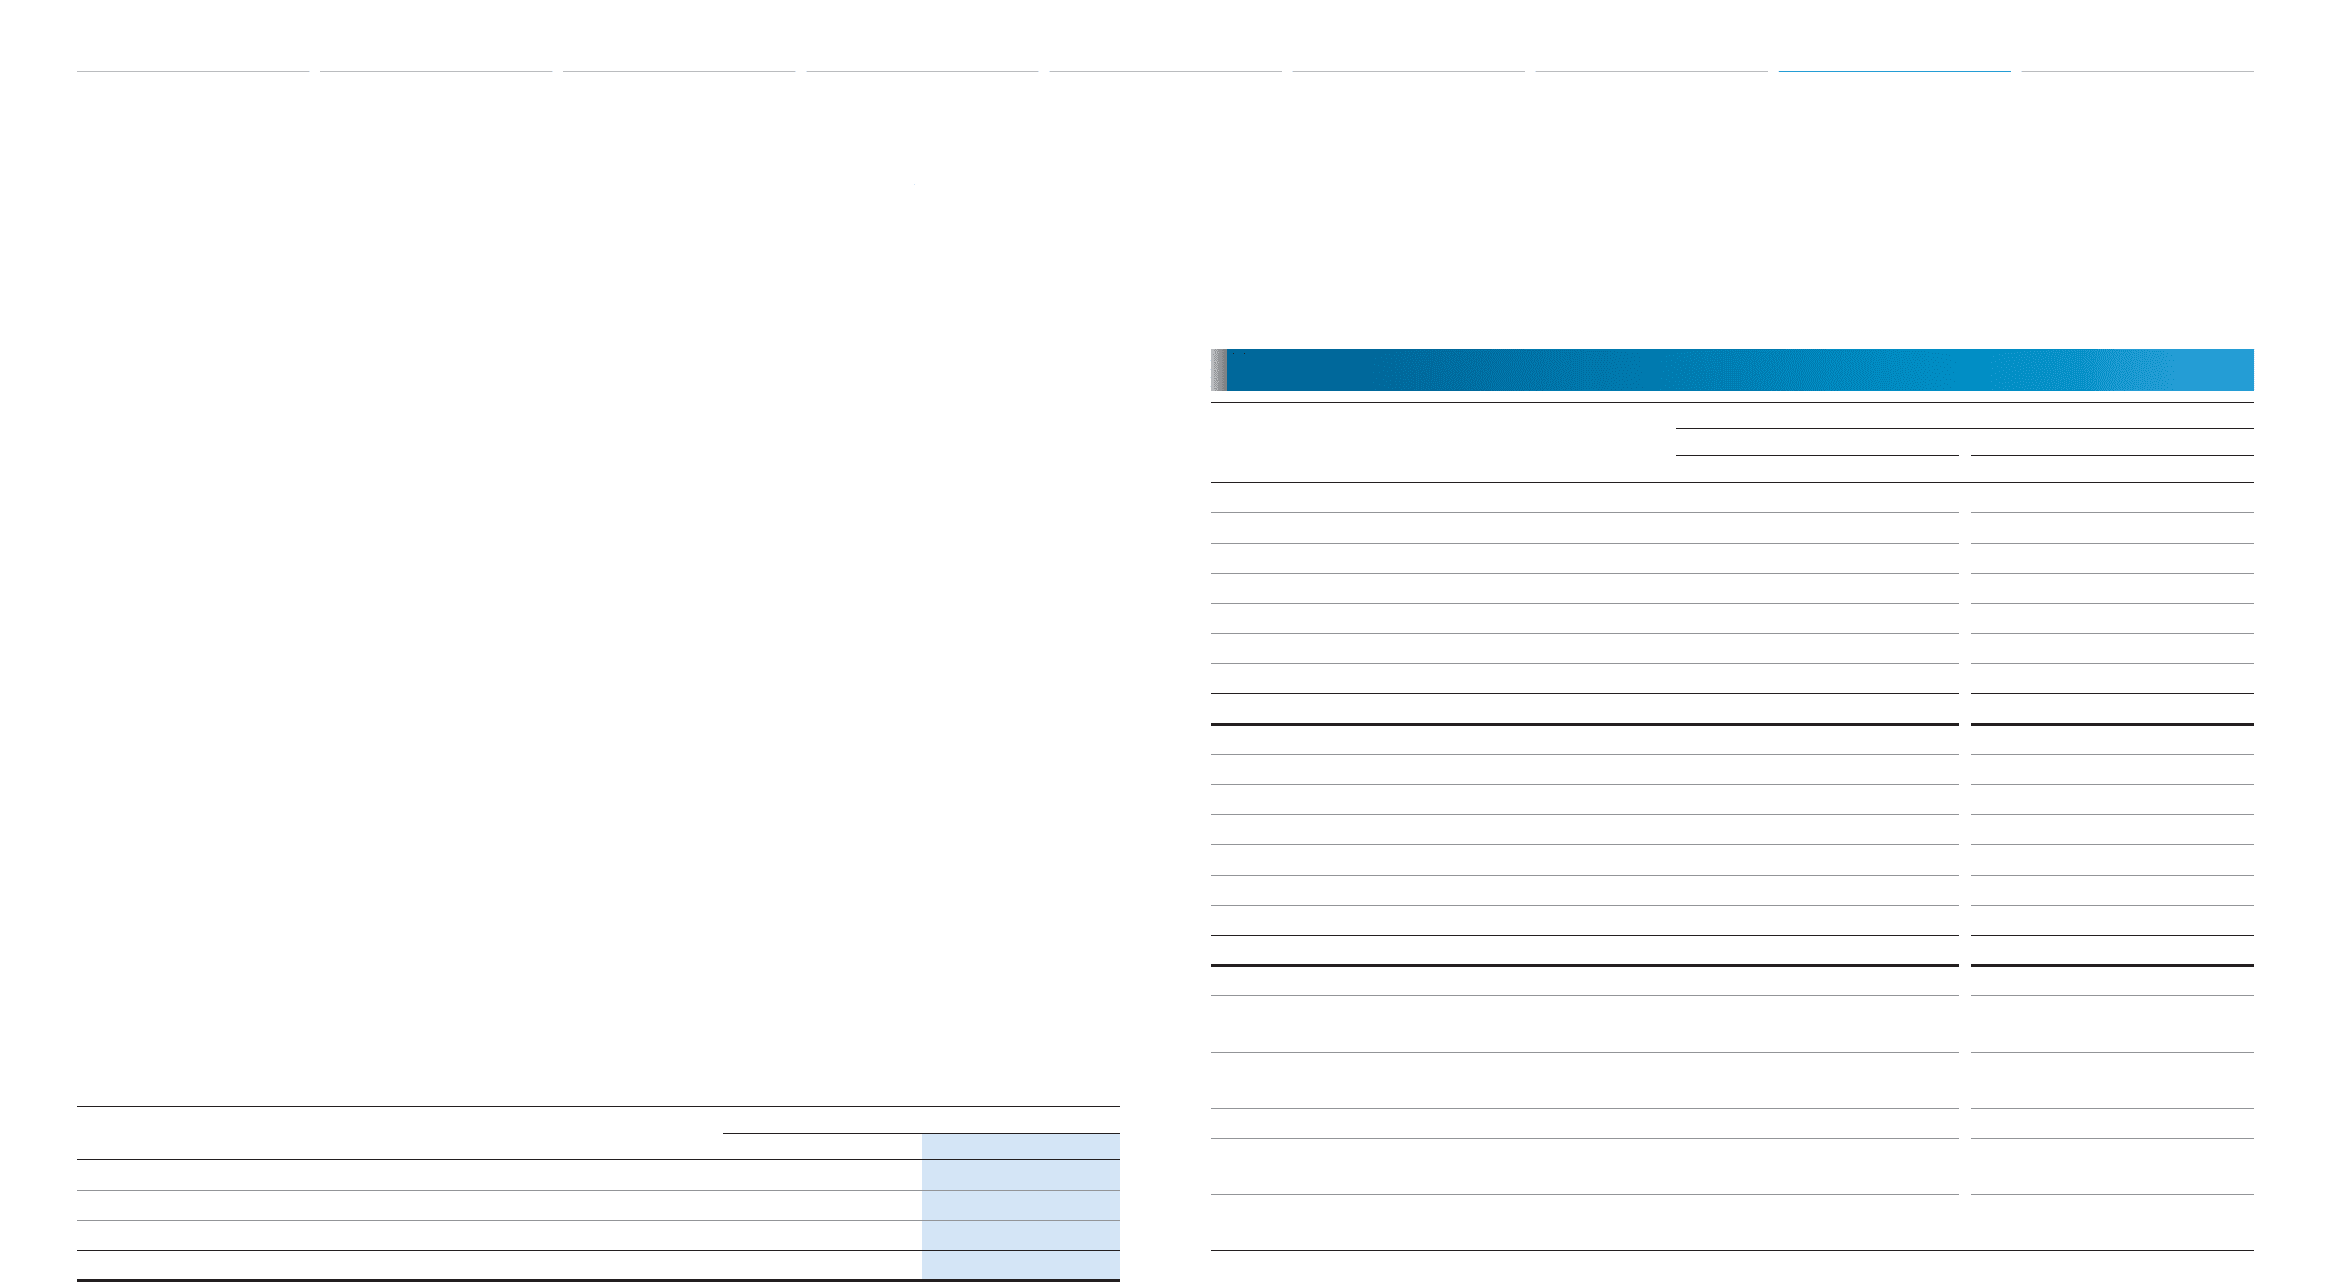
Ratio of credit loss experience in the United States is as follows:
Years ended March 31,
2012 2013
Net charge-offs as a percentage of average gross earning assets:
Finance receivables 0.24% 0.29%
Operating lease 0.11 0.18
Total 0.21% 0.27%
All Other Operations Segment
Net revenues for Toyota’s other operations seg-
ments increased by ¥17.5 billion, or 1.7%, to
¥1,066.4 billion during fi
scal 2013 compared with
the prior fi scal year.
Operating income from Toyota’s other operations
segments increased by ¥11.5 billion, or 27.5%, to
¥53.6 billion during fi scal 2013 compared with the
prior fi scal year.
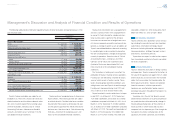
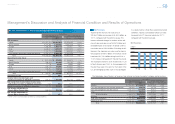
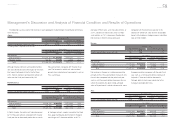
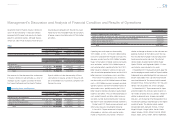
Yen in millions
Years ended March 31, 2012 vs. 2011 Change
2011 2012 Amount Percentage (%)
Net revenues:
Japan ¥10,986,246 ¥11,167,319 ¥ 181,073 +1.6
North America 5,429,136 4,751,886 (677,250) –12.5
Europe 1,981,497 1,993,946 12,449 +0.6
Asia 3,374,534 3,334,274 (40,260) –1.2
Other* 1,809,116 1,760,175 (48,941) –2.7
Intersegment elimination/unallocated amount (4,586,841) (4,423,947) 162,894 —
Total ¥18,993,688 ¥18,583,653 ¥(410,035) –2.2
Operating income (loss):
Japan ¥ (362,396) ¥ (207,040) ¥ 155,356 —
North America 339,503 186,409 (153,094) –45.1
Europe 13,148 17,796 4,648 +35.4
Asia 312,977 256,790 (56,187) –18.0
Other* 160,129 108,814 (51,315) –32.0
Intersegment elimination/unallocated amount 4,918 (7,142) (12,060) —
Total ¥ 468,279 ¥ 355,627 ¥(112,652) –24.1
Operating margin 2.5% 1.9% (0.6)%
Income before income taxes and
equity in earnings of affi liated companies 563,290 432,873 (130,417) –23.2
Net margin from income before income taxes
and equity in earnings of affi liated companies 3.0% 2.3% (0.7)%
Equity in earnings of affi liated companies 215,016 197,701 (17,315) –8.1
Net income attributable to
Toyota Motor Corporation 408,183 283,559 (124,624) –30.5
Net margin attributable to
Toyota Motor Corporation 2.1% 1.5% (0.6)%
* “Other” consists of Central and South America, Oceania and Africa.
Results of Operations — Fiscal 2012 Compared with Fiscal 2011
Management’s Discussion and Analysis of Financial Condition and Results of Operations
Selected Financial Summary (U.S. GAAP) Consolidated Segment Information Consolidated Quarterly Financial Summary Management’s Discussion and Analysis of Financial Condition and Results of Operations [11 of 26] Consolidated Financial Statements Notes to Consolidated Financial Statements
Management’s Annual Report on Internal Control over Financial Reporting Report of Independent Registered Public Accounting Firm