Toyota 2013 Annual Report Download - page 28
Download and view the complete annual report
Please find page 28 of the 2013 Toyota annual report below. You can navigate through the pages in the report by either clicking on the pages listed below, or by using the keyword search tool below to find specific information within the annual report.-
 1
1 -
2
-
3
-
4
-
5
-
6
-
7
-
8
-
9
-
10
-
11
-
12
-
13
-
14
-
15
-
16
-
17
-
 18
18 -
 19
19 -
 20
20 -
 21
21 -
 22
22 -
 23
23 -
 24
24 -
 25
25 -
 26
26 -
 27
27 -
 28
28 -
 29
29 -
 30
30 -
 31
31 -
 32
32 -
 33
33 -
 34
34 -
 35
35 -
 36
36 -
 37
37 -
 38
38 -
39
-
40
-
41
-
42
-
43
-
44
-
45
-
46
-
47
-
48
-
49
-
50
-
51
-
52
-
53
-
54
-
55
-
56
-
57
-
58
-
59
-
60
-
61
-
62
-
63
-
64
-
65
-
66
-
67
-
68
-
69
-
70
-
71
-
72
-
73
-
74
-
75
-
76
-
77
-
78
-
79
-
80
-
81
-
82
-
83
-
84
-
85
-
86
-
87
-
88
-
89
-
90
-
91
-
92
-
93
-
94
-
95
-
96
-
97
-
98
-
99
-
100
-
101
-
102
-
103
-
104
-
105
-
106
-
107
-
108
-
109
-
110
-
111
-
112
-
113
-
114
-
115
-
116
-
117
-
118
-
119
-
120
-
121
-
122
-
123
-
124
 |
 |
Toyota Global Vision President’s Message Launching a New Structure Special Feature Review of Operations
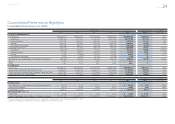
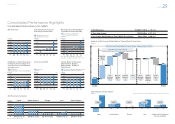
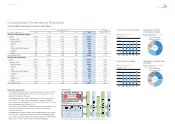
Consolidated Performance
Highlights
Management and
Corporate Information Investor InformationFinancial Section
Page 28
NextPrev
ContentsSearchPrint
ANNUAL REPORT 2013
1,500
0
1,200
900
600
300
FY
400
0
300
200
100
-100
FY
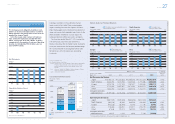
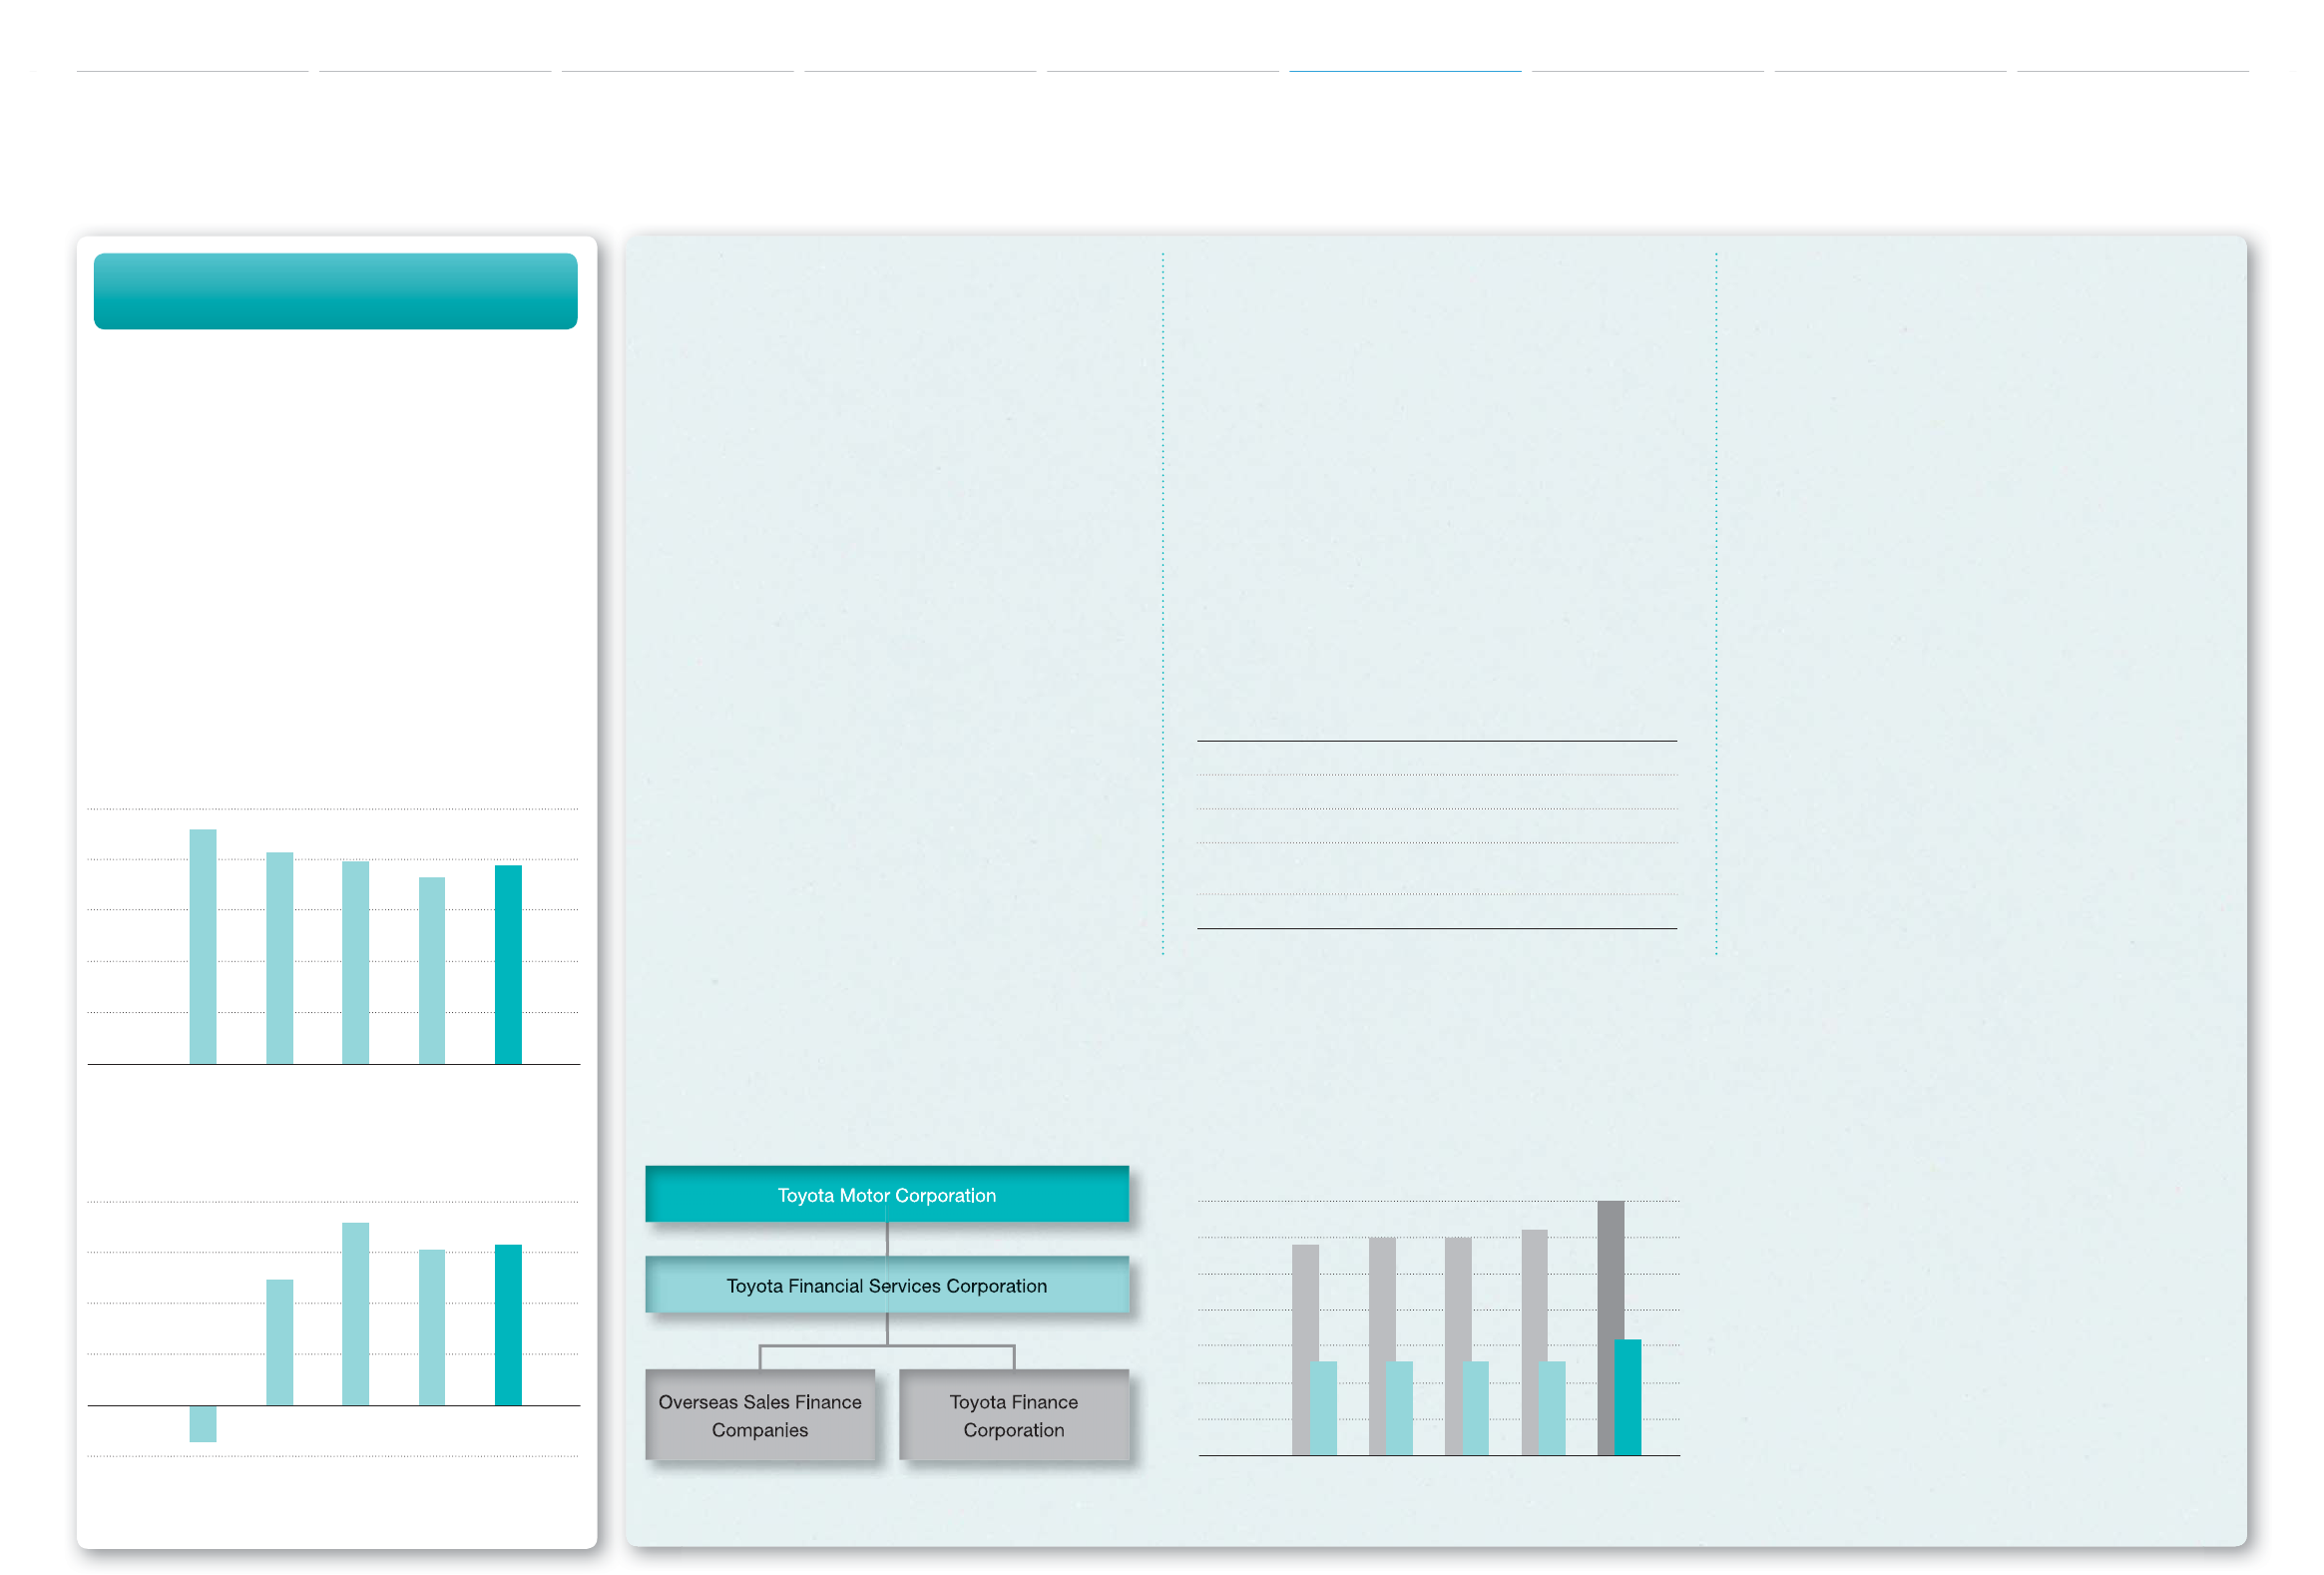
Net Revenues
(¥ Billion)
’09 ’10 ’11 ’12 ’13
Operating Income
(¥ Billion)
’09 ’10 ’11 ’12 ’13
Note: Fiscal years ended March 31
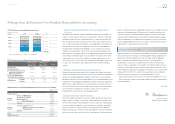
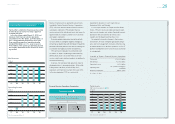
Toyota’s fi nancial services operations are primarily
handled by Toyota Financial Services Corporation
(TFS), which has overall control of fi nancial services
subsidiaries worldwide. TFS provides fi nancial
services primarily for vehicle purchases and leases to
approximately 9.0 million customers in 34 countries
and regions worldwide.
During the period under review, we continued with
last year’s efforts to strengthen regional strategies by
enhancing our relationships with distributors through the
provision of fi nancial products and services meeting vari-
ous national and regional customer characteristics.
TFS continued to broaden its connections with
customers in Japan, responding to their needs by
offering ready access to sound fi nancial services
such as credit cards and housing loans in addition to
automotive fi nancing.
Overseas, the Company took proactive steps to
develop business in emerging markets. After estab-
lishing a local subsidiary in India in May 2011,
operations commenced in earnest from June 2012.
In the ensuing period, TFS has successfully
expanded its business in such major cities as
Bangalore, Delhi, and Mumbai.
In such major markets as Europe and the United
States, TFS aims to ensure stable earnings by work-
ing to secure margins and achieve thorough low-cost
operations with consideration for vehicle sales
support and the balancing of business risks.
To respond to dramatic changes in the business
environment, TFS will strengthen groupwide compli-
ance and risk management structures while focusing
on enhancements to its business platform, such as IT
platform development and human resource cultivation
in management.
Overview of Toyota’s Financial Services Operations
Total assets ¥16,231.4 billion
Net revenues ¥1,170.6 billion
Operating income ¥315.8 billion
Operating areas 34 countries and regions
worldwide
Number of employees approx. 9,000
(As of March 31, 2013)
35
0
25
30
20
5
10
15
FY
Note: Fiscal years ended March 31
Total Assets
(¥ Trillion)
’09 ’10 ’11 ’12 ’13
왎왎 Toyota (Consolidated) 왎왎 TFS
Financial Services Operations Organization
Toyota offers automotive fi nancing and a variety
of other fi nancial services for total support of
customer lifestyles.
In the fi scal year ended March 31, 2013, net
revenues from fi nancial service operations
amounted to ¥1,170.6 billion, up ¥70.3 billion, or
6.4%, compared with the previous fi scal year.
From a profi t perspective, operating income
climbed ¥9.3 billion, or 3.1%, year on year to
¥315.8 billion. This upswing in operating income
was largely attributable to the increase in fi nanc-
ing volume.
Financial Services Operations
Automotive Operations Financial Services Operations Non-Automotive Business Operations