Toyota 2013 Annual Report Download - page 60
Download and view the complete annual report
Please find page 60 of the 2013 Toyota annual report below. You can navigate through the pages in the report by either clicking on the pages listed below, or by using the keyword search tool below to find specific information within the annual report.-
 1
1 -
2
-
3
-
4
-
5
-
6
-
7
-
8
-
9
-
10
-
11
-
12
-
13
-
14
-
15
-
16
-
17
-
18
-
19
-
20
-
21
-
22
-
23
-
24
-
25
-
26
-
27
-
28
-
29
-
30
-
31
-
32
-
33
-
34
-
35
-
36
-
37
-
38
-
39
-
40
-
41
-
42
-
43
-
44
-
45
-
46
-
47
-
48
-
49
-
 50
50 -
 51
51 -
 52
52 -
 53
53 -
 54
54 -
 55
55 -
 56
56 -
 57
57 -
 58
58 -
 59
59 -
 60
60 -
 61
61 -
 62
62 -
 63
63 -
 64
64 -
 65
65 -
 66
66 -
 67
67 -
 68
68 -
 69
69 -
 70
70 -
71
-
72
-
73
-
74
-
75
-
76
-
77
-
78
-
79
-
80
-
81
-
82
-
83
-
84
-
85
-
86
-
87
-
88
-
89
-
90
-
91
-
92
-
93
-
94
-
95
-
96
-
97
-
98
-
99
-
100
-
101
-
102
-
103
-
104
-
105
-
106
-
107
-
108
-
109
-
110
-
111
-
112
-
113
-
114
-
115
-
116
-
117
-
118
-
119
-
120
-
121
-
122
-
123
-
124
 |
 |

Toyota Global Vision President’s Message Launching a New Structure Special Feature Review of Operations
Consolidated Performance
Highlights
Management and
Corporate Information Investor InformationFinancial Section
Page 60
NextPrev
ContentsSearchPrint
ANNUAL REPORT 2013
and Highlander Hybrid, 549 thousand vehicles were
included in this recall.
Cost Reduction Efforts
During fi scal 2012, Toyota’s continued cost reduc-
tion efforts reduced operating costs and expenses
by ¥150.0 billion. The amount of effect of cost
reduction efforts includes the impact of fl uctuation in
the price of steel, precious metals, non-ferrous
alloys including aluminum, plastic parts and other
production materials and parts. In fi scal 2012, raw
materials prices were on an increasing trend; how-
ever, continued cost reduction efforts together with
suppliers contributed to the improvement in earn-
ings by more than offsetting the effects from raw
materials price increase. These cost reduction
efforts related to ongoing value engineering and
value analysis activities, the use of common parts
resulting in a reduction of part types and other man-
ufacturing initiatives designed to reduce the costs of
vehicle production.
Cost of Products Sold
Cost of products sold decreased by ¥189.8 billion,
or 1.2%, to ¥15,795.9 billion during fi
scal 2012
compared with the prior fi scal year. The decrease
resulted from the ¥343.6 billion favorable impact of
fl uctuations in foreign currency translation rates and
others, and the ¥150.0 billion impact of cost reduc-
tion efforts, partially offset by the ¥135.0 billion
impact of changes in vehicle unit sales and sales
mix and other operational factors, and ¥110.0 billion
increase in miscellaneous costs and others. The
increase in miscellaneous costs was due mainly to
the ¥50.0 billion increase in research and develop-
ment expenses and the ¥80.0 billion increase in
labor costs.
Cost of Financing Operations
Cost of fi nancing operations decreased by ¥36.8
billion, or 5.9%, to ¥592.6 billion during fi
scal 2012
compared with the prior fi scal year. The decrease
resulted from the ¥35.7 billion favorable impact of
fl uctuations in foreign currency translation rates and
others, partially offset by the ¥20.8 billion recording
of valuation losses on interest rate swaps stated at
fair value.
Selling, General and Administrative Expenses
Selling, general and administrative expenses
decreased by ¥70.6 billion, or 3.7%, to ¥1,839.4
billion during fi
scal 2012 compared with the prior
fi scal year. This decrease refl ects the ¥53.0 billion
favorable impact of fl uctuations in foreign currency
translation rates and others, and the ¥19.2 billion
decrease for the fi nancial services operations.
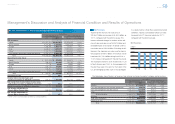
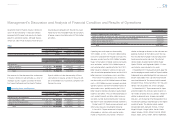
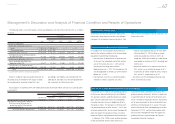
Operating Income
Yen in millions
2012 vs. 2011 Change
Changes in operating income and loss:
Effect of changes in vehicle unit sales and sales mix and other operational factors ¥ 170,000
Effect of fl uctuation in foreign currency translation rates and others (285,400)
Effect of increase in miscellaneous costs and others (100,000)
Effect of cost reduction efforts, fi nancial services operations, and others 102,748
Total ¥(112,652)
Toyota’s operating income decreased by ¥112.6 bil-
lion, or 24.1%, to ¥355.6 billion during fi scal 2012
compared with the prior fi scal year. This decrease
was due mainly to the ¥285.4 billion unfavorable
impact of fl uctuations in foreign currency translation
rates and others, and the ¥100.0 billion increase in
miscellaneous costs and others, partially offset by
the ¥170.0 billion of favorable impact by changes in
vehicle unit sales and sales mix and other opera-
tional factors and the ¥102.7 billion increase of cost
reduction efforts, fi nancial services operations, and
others. The unfavorable impact of fl uctuations in for-
eign currency translation rates and others included
¥250.0 billion unfavorable impact of fl uctuations
in foreign currency transaction rates. The
¥102.7 billion increase of cost reduction efforts,
fi nancial services operations, and others refl ects the
¥150.0 billion impact of cost reduction efforts, par-
tially offset by the ¥10.0 billion decrease in operating
income in the fi nancial services operations.
During fi scal 2012, operating loss (before elimina-
tion of intersegment profi ts), decreased by
¥155.3 billion in Japan compared with the prior
fi scal year. During fi scal 2012, operating income
(before elimination of intersegment profi ts), increased
by ¥4.6 billion, or 35.4%, in Europe compared
with the prior fi scal year, whereas it decreased by
¥153.0 billion, or 45.1%, in North America, decreased
by ¥56.2 billion, or 18.0%, in Asia, and decreased
by ¥51.3 billion, or 32.0%, in Other.
The following is a description of operating income and loss in each geographic market.
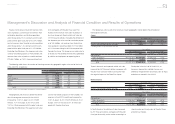
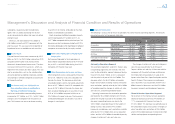
Japan
Yen in millions
2012 vs. 2011 Change
Changes in operating income and loss:
Effect of changes in vehicle unit sales and sales mix and other operational factors ¥195,000
Effect of fl uctuation in foreign currency translation rates and others (275,000)
Effect of cost reduction efforts, decrease in miscellaneous costs and others 235,356
Total ¥155,356
Management’s Discussion and Analysis of Financial Condition and Results of Operations
Selected Financial Summary (U.S. GAAP) Consolidated Segment Information Consolidated Quarterly Financial Summary Management’s Discussion and Analysis of Financial Condition and Results of Operations [15 of 26] Consolidated Financial Statements Notes to Consolidated Financial Statements
Management’s Annual Report on Internal Control over Financial Reporting Report of Independent Registered Public Accounting Firm