Toyota 2013 Annual Report Download - page 113
Download and view the complete annual report
Please find page 113 of the 2013 Toyota annual report below. You can navigate through the pages in the report by either clicking on the pages listed below, or by using the keyword search tool below to find specific information within the annual report.-
 1
1 -
2
-
3
-
4
-
5
-
6
-
7
-
8
-
9
-
10
-
11
-
12
-
13
-
14
-
15
-
16
-
17
-
18
-
19
-
20
-
21
-
22
-
23
-
24
-
25
-
26
-
27
-
28
-
29
-
30
-
31
-
32
-
33
-
34
-
35
-
36
-
37
-
38
-
39
-
40
-
41
-
42
-
43
-
44
-
45
-
46
-
47
-
48
-
49
-
50
-
51
-
52
-
53
-
54
-
55
-
56
-
57
-
58
-
59
-
60
-
61
-
62
-
63
-
64
-
65
-
66
-
67
-
68
-
69
-
70
-
71
-
72
-
73
-
74
-
75
-
76
-
77
-
78
-
79
-
80
-
81
-
82
-
83
-
84
-
85
-
86
-
87
-
88
-
89
-
90
-
91
-
92
-
93
-
94
-
95
-
96
-
97
-
98
-
99
-
100
-
101
-
102
-
 103
103 -
 104
104 -
 105
105 -
 106
106 -
 107
107 -
 108
108 -
 109
109 -
 110
110 -
 111
111 -
 112
112 -
 113
113 -
 114
114 -
 115
115 -
 116
116 -
 117
117 -
 118
118 -
 119
119 -
 120
120 -
 121
121 -
 122
122 -
 123
123 -
124
 |
 |
Toyota Global Vision President’s Message Launching a New Structure Special Feature Review of Operations
Consolidated Performance
Highlights
Management and
Corporate Information Investor InformationFinancial Section
Page 113
NextPrev
ContentsSearchPrint
ANNUAL REPORT 2013
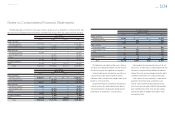
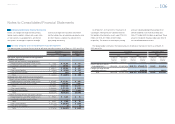
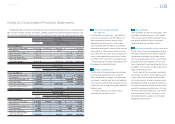
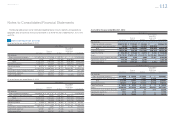
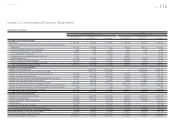
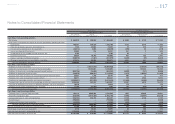
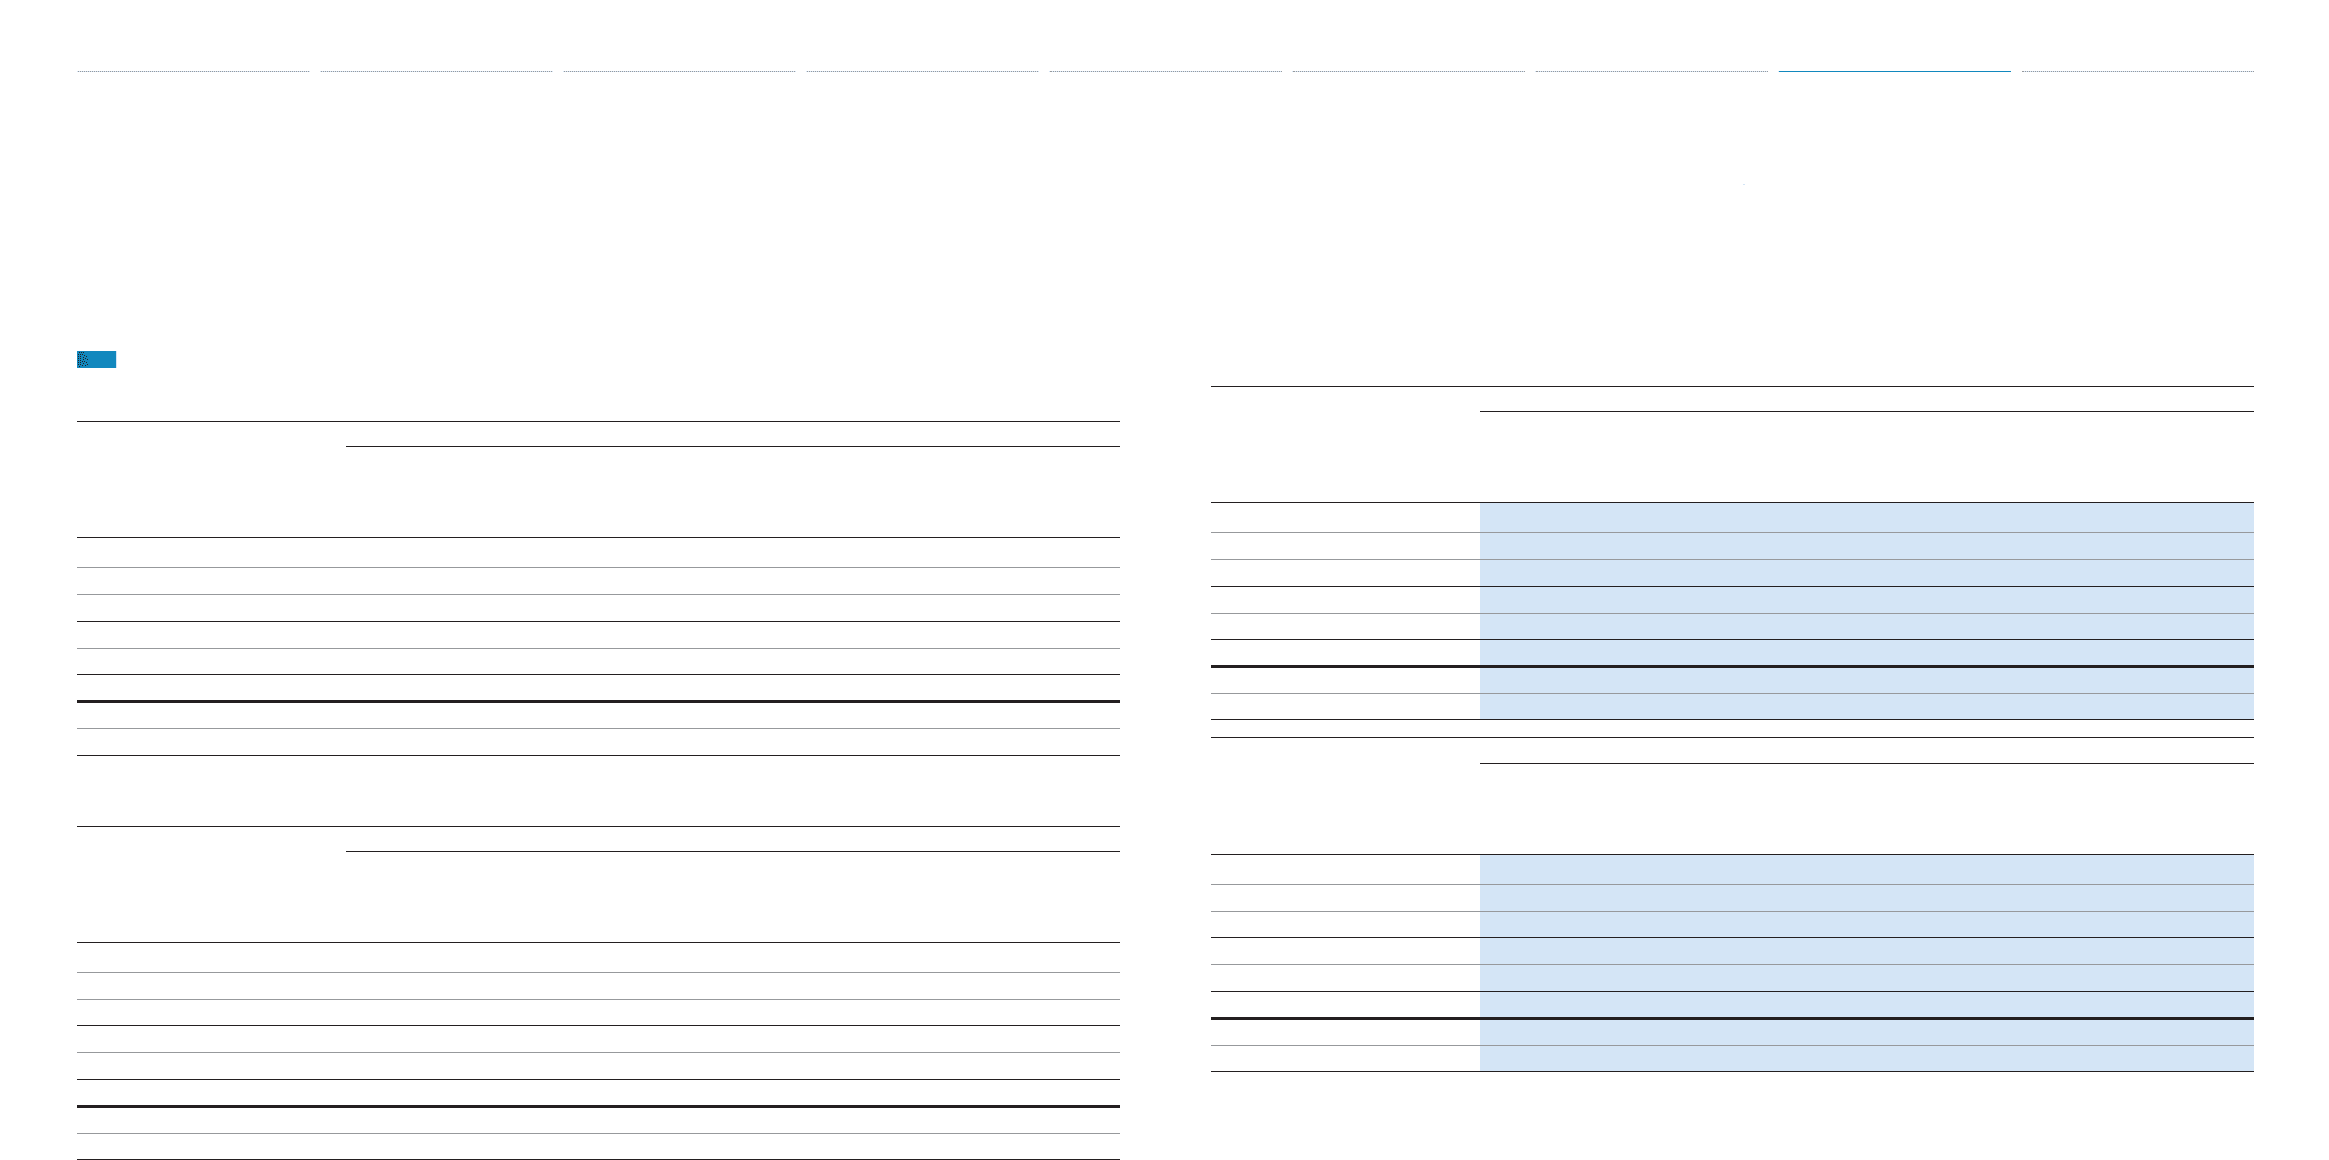
Geographic Information
As of and for the year ended March 31, 2011:
Yen in millions
Japan
North
America Europe Asia Other
Inter-segment
Elimination/
Unallocated
Amount Consolidated
Net revenues
Sales to external customers ¥ 6,966,929 ¥5,327,809 ¥1,920,416 ¥3,138,112 ¥1,640,422 ¥ — ¥18,993,688
Inter-segment sales and transfers 4,019,317 101,327 61,081 236,422 168,694 (4,586,841) —
Total 10,986,246 5,429,136 1,981,497 3,374,534 1,809,116 (4,586,841) 18,993,688
Operating expenses 11,348,642 5,089,633 1,968,349 3,061,557 1,648,987 (4,591,759) 18,525,409
Operating income (loss) ¥ (362,396) ¥ 339,503 ¥ 13,148 ¥ 312,977 ¥ 160,129 ¥ 4,918 ¥ 468,279
Assets ¥11,285,864 ¥9,910,828 ¥1,931,231 ¥2,138,499 ¥2,044,379 ¥2,507,365 ¥29,818,166
Long-lived assets 3,123,042 2,276,332 305,627 344,304 259,855 — 6,309,160
As of and for the year ended March 31, 2012:
Yen in millions
Japan
North
America Europe Asia Other
Inter-segment
Elimination/
Unallocated
Amount Consolidated
Net revenues
Sales to external customers ¥ 7,293,804 ¥4,644,348 ¥1,917,408 ¥3,116,849 ¥1,611,244 ¥ — ¥18,583,653
Inter-segment sales and transfers 3,873,515 107,538 76,538 217,425 148,931 (4,423,947) —
Total 11,167,319 4,751,886 1,993,946 3,334,274 1,760,175 (4,423,947) 18,583,653
Operating expenses 11,374,359 4,565,477 1,976,150 3,077,484 1,651,361 (4,416,805) 18,228,026
Operating income (loss) ¥ (207,040) ¥ 186,409 ¥ 17,796 ¥ 256,790 ¥ 108,814 ¥ (7,142) ¥ 355,627
Assets ¥12,034,423 ¥9,693,232 ¥1,960,532 ¥2,433,312 ¥2,175,493 ¥2,353,973 ¥30,650,965
Long-lived assets 2,981,985 2,197,197 263,070 412,959 380,169 — 6,235,380
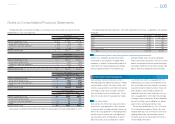
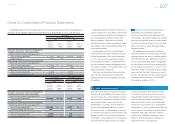
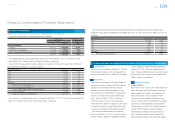
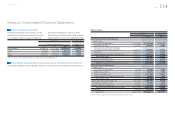
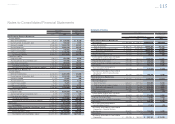
As of and for the year ended March 31, 2013:
Yen in millions
Japan
North
America Europe Asia Other
Inter-segment
Elimination/
Unallocated
Amount Consolidated
Net revenues
Sales to external customers ¥ 7,910,456 ¥ 6,167,821 ¥2,003,113 ¥4,058,629 ¥1,924,173 ¥ — ¥22,064,192
Inter-segment sales and transfers 4,910,562 116,604 80,000 326,847 170,092 (5,604,105) —
Total 12,821,018 6,284,425 2,083,113 4,385,476 2,094,265 (5,604,105) 22,064,192
Operating expenses 12,244,683 6,062,500 2,056,651 4,009,421 1,960,521 (5,590,472) 20,743,304
Operating income ¥ 576,335 ¥ 221,925 ¥ 26,462 ¥ 376,055 ¥ 133,744 ¥ (13,633) ¥ 1,320,888
Assets ¥12,296,731 ¥11,841,471 ¥2,199,256 ¥3,305,319 ¥2,616,164 ¥3,224,376 ¥35,483,317
Long-lived assets 2,929,346 2,633,067 288,288 590,021 410,517 — 6,851,239
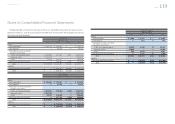
U.S. dollars in millions
Japan
North
America Europe Asia Other
Inter-segment
Elimination/
Unallocated
Amount Consolidated
Net revenues
Sales to external customers $ 84,109 $ 65,580 $21,299 $43,154 $20,459 $ — $234,601
Inter-segment sales and transfers 52,212 1,240 850 3,475 1,809 (59,586) —
Total 136,321 66,820 22,149 46,629 22,268 (59,586) 234,601
Operating expenses 130,193 64,460 21,868 42,630 20,846 (59,441) 220,556
Operating income $ 6,128 $ 2,360 $ 281 $ 3,999 $ 1,422 $ (145) $ 14,045
Assets $130,747 $125,906 $23,384 $35,144 $27,817 $34,283 $377,281
Long-lived assets 31,147 27,996 3,065 6,274 4,365 — 72,847
“Other” consists of Central and South America, Oceania and Africa.
Revenues are attributed to geographies based on
the country location of the parent company or
the˛subsidiary that transacted the sale with the
external customer.
There are no any individually material countries
with respect to revenues, and long-lived assets
included in other foreign countries.
Unallocated amounts included in assets represent
assets held for corporate purposes, which mainly
consist of cash and cash equivalents and
marketable securities. Such corporate assets were
¥4,613,672 million, ¥4,749,259 million and
¥5,599,970 million ($59,542 million), as of March
31, 2011, 2012 and 2013, respectively.
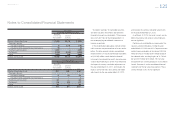
Transfers between industries or geographic
segments are made at amounts which Toyota’s
management believes approximate arm’s-length
transactions. In measuring the reportable segments’
income or losses, operating income consists of rev-
enue less operating expenses.
Notes to Consolidated Financial Statements
Selected Financial Summary (U.S. GAAP) Consolidated Segment Information Consolidated Quarterly Financial Summary Management’s Discussion and Analysis of Financial Condition and Results of Operations Consolidated Financial Statements Notes to Consolidated Financial Statements [36 of 44]
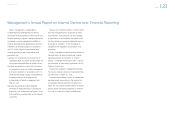
Management’s Annual Report on Internal Control over Financial Reporting Report of Independent Registered Public Accounting Firm