Toyota 2013 Annual Report Download - page 50
Download and view the complete annual report
Please find page 50 of the 2013 Toyota annual report below. You can navigate through the pages in the report by either clicking on the pages listed below, or by using the keyword search tool below to find specific information within the annual report.-
 1
1 -
2
-
3
-
4
-
5
-
6
-
7
-
8
-
9
-
10
-
11
-
12
-
13
-
14
-
15
-
16
-
17
-
18
-
19
-
20
-
21
-
22
-
23
-
24
-
25
-
26
-
27
-
28
-
29
-
30
-
31
-
32
-
33
-
34
-
35
-
36
-
37
-
38
-
39
-
 40
40 -
 41
41 -
 42
42 -
 43
43 -
 44
44 -
 45
45 -
 46
46 -
 47
47 -
 48
48 -
 49
49 -
 50
50 -
 51
51 -
 52
52 -
 53
53 -
 54
54 -
 55
55 -
 56
56 -
 57
57 -
 58
58 -
 59
59 -
 60
60 -
61
-
62
-
63
-
64
-
65
-
66
-
67
-
68
-
69
-
70
-
71
-
72
-
73
-
74
-
75
-
76
-
77
-
78
-
79
-
80
-
81
-
82
-
83
-
84
-
85
-
86
-
87
-
88
-
89
-
90
-
91
-
92
-
93
-
94
-
95
-
96
-
97
-
98
-
99
-
100
-
101
-
102
-
103
-
104
-
105
-
106
-
107
-
108
-
109
-
110
-
111
-
112
-
113
-
114
-
115
-
116
-
117
-
118
-
119
-
120
-
121
-
122
-
123
-
124
 |
 |
Toyota Global Vision President’s Message Launching a New Structure Special Feature Review of Operations
Consolidated Performance
Highlights
Management and
Corporate Information Investor InformationFinancial Section
Page 50
NextPrev
ContentsSearchPrint
ANNUAL REPORT 2013
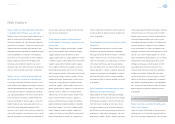
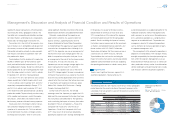
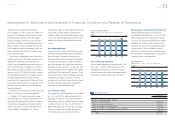
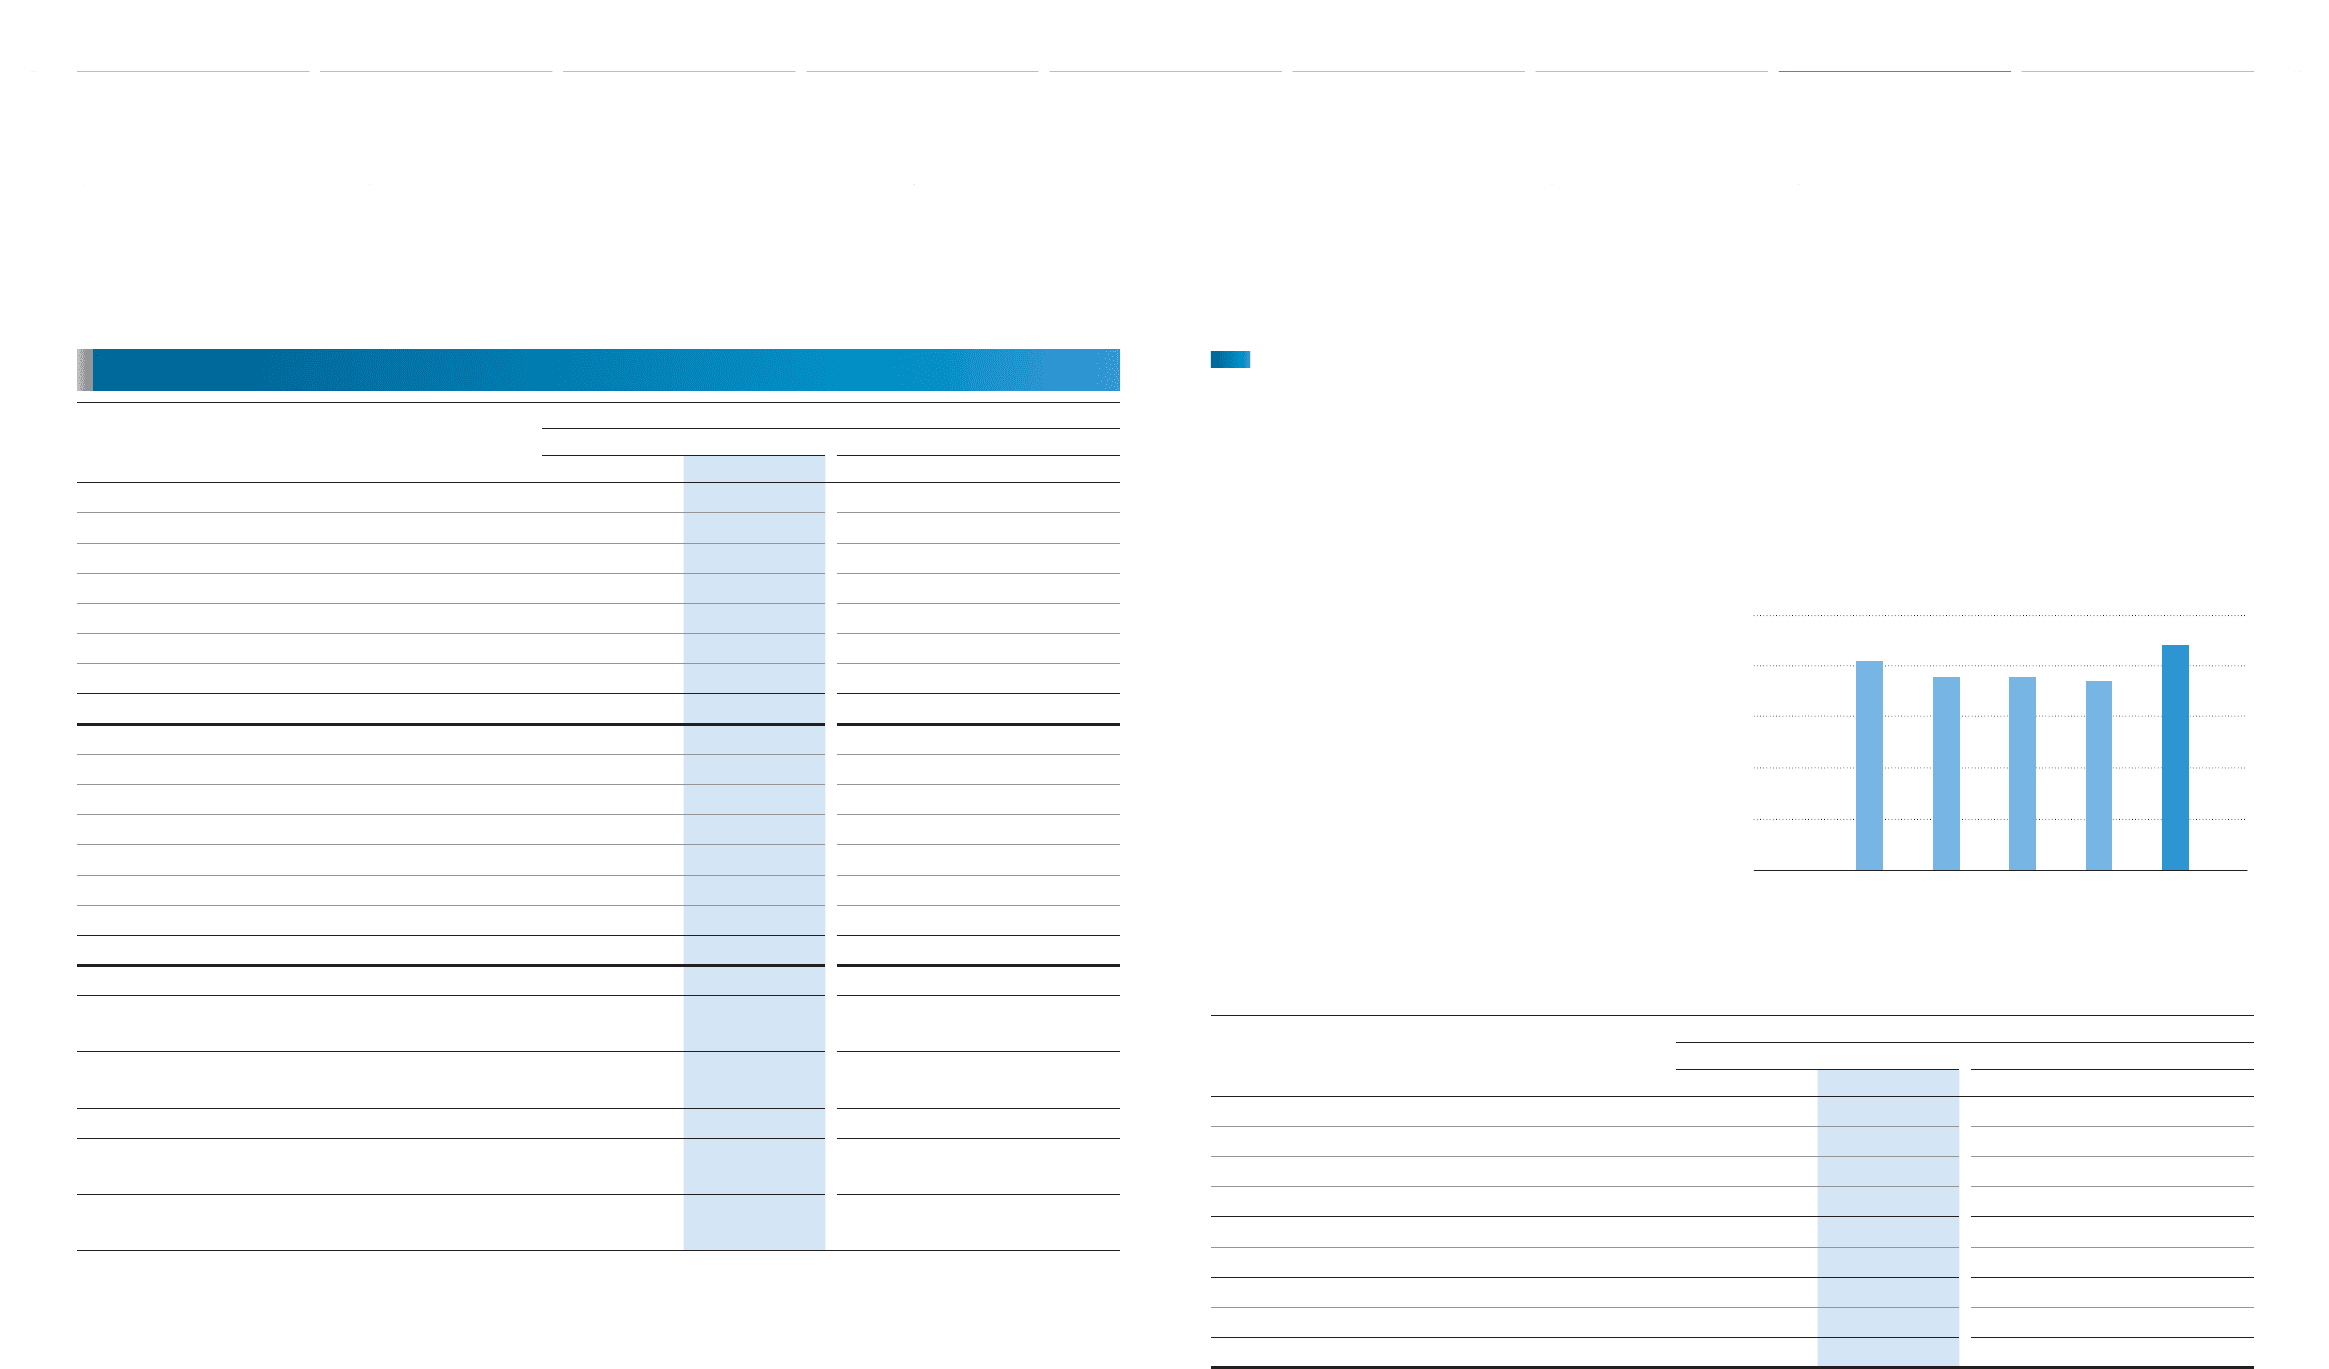
Net Revenues
Toyota had net revenues for fi scal 2013 of
¥22,064.1 billion, an increase of ¥3,480.5 billion, or
18.7%, compared with the prior fi scal year. This
increase refl ected changes in numbers of the vehi-
cle unit sales and sales mix of ¥3,031.5 billion and
favorable impact of fl uctuations in foreign currency
translation rates of ¥281.8 billion. Excluding the dif-
ference in the Japanese yen value used for transla-
tion purposes of ¥281.8 billion, net revenues would
have been ¥21,782.3 billion during fi scal 2013, a
17.2% increase compared with the prior fi scal year.
The automotive market in 2012 increased by 11.3%
in North America and 14.3% in Asia compared with
the prior fi scal year. In fi scal 2013, the market in the
U.S. and emerging countries such as Asia developed
in a steady manner. Under these automotive market
conditions, Toyota’s consolidated vehicle unit sales
increased to 8,871 thousand vehicles by 20.7%
compared with the prior fi scal year.
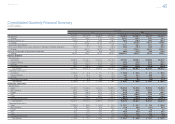
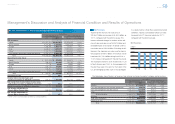
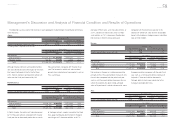
Yen in millions
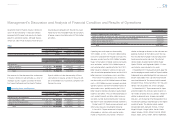
Years ended March 31, 2013 vs. 2012 Change
2012 2013 Amount Percentage (%)
Net revenues:
Japan ¥11,167,319 ¥12,821,018 ¥1,653,699 +14.8
North America 4,751,886 6,284,425 1,532,539 +32.3
Europe 1,993,946 2,083,113 89,167 +4.5
Asia 3,334,274 4,385,476 1,051,202 +31.5
Other* 1,760,175 2,094,265 334,090 +19.0
Intersegment elimination/unallocated amount (4,423,947) (5,604,105) (1,180,158) —
Total ¥18,583,653 ¥22,064,192 ¥3,480,539 +18.7
Operating income (loss):
Japan ¥ (207,040) ¥ 576,335 ¥ 783,375 —
North America 186,409 221,925 35,516 +19.1
Europe 17,796 26,462 8,666 +48.7
Asia 256,790 376,055 119,265 +46.4
Other* 108,814 133,744 24,930 +22.9
Intersegment elimination/unallocated amount (7,142) (13,633) (6,491) —
Total ¥ 355,627 ¥ 1,320,888 ¥ 965,261 +271.4
Operating margin 1.9% 6.0% 4.1%
Income before income taxes and
equity in earnings of affi liated companies 432,873 1,403,649 970,776 +224.3
Net margin from income before income taxes
and equity in earnings of affi liated companies 2.3% 6.4% 4.1%
Equity in earnings of affi liated companies 197,701 231,519 33,818 +17.1
Net income attributable to
Toyota Motor Corporation 283,559 962,163 678,604 +239.3
Net margin attributable to
Toyota Motor Corporation 1.5% 4.4% 2.9%
* “Other” consists of Central and South America, Oceania and Africa.
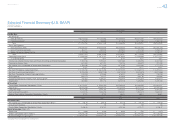
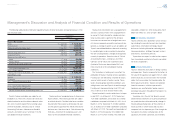
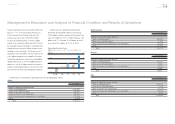
Results of Operations — Fiscal 2013 Compared with Fiscal 2012
The table below shows Toyota’s net revenues from external customers by product category and by business.
Yen in millions
Years ended March 31, 2013 vs. 2012 Change
2012 2013 Amount Percentage (%)
Vehicles ¥14,164,940 ¥17,446,473 ¥3,281,533 +23.2
Parts and components for overseas production 338,000 356,756 18,756 +5.5
Parts and components for after service 1,532,219 1,577,690 45,471 +3.0
Other 929,219 997,843 68,624 +7.4
Total Automotive 16,964,378 20,378,762 3,414,384 +20.1
All Other 547,538 535,388 (12,150) –2.2
Total sales of products 17,511,916 20,914,150 3,402,234 +19.4
Financial services 1,071,737 1,150,042 78,305 +7.3
Total ¥18,583,653 ¥22,064,192 ¥3,480,539 +18.7
25,000
0
20,000
15,000
10,000
5,000
FY
Net Revenues
(¥ Billion)
’09 ’10 ’11 ’12 ’13
Management’s Discussion and Analysis of Financial Condition and Results of Operations
Selected Financial Summary (U.S. GAAP) Consolidated Segment Information Consolidated Quarterly Financial Summary Management’s Discussion and Analysis of Financial Condition and Results of Operations [5 of 26] Consolidated Financial Statements Notes to Consolidated Financial Statements
Management’s Annual Report on Internal Control over Financial Reporting Report of Independent Registered Public Accounting Firm