Toyota 2013 Annual Report Download - page 103
Download and view the complete annual report
Please find page 103 of the 2013 Toyota annual report below. You can navigate through the pages in the report by either clicking on the pages listed below, or by using the keyword search tool below to find specific information within the annual report.-
 1
1 -
2
-
3
-
4
-
5
-
6
-
7
-
8
-
9
-
10
-
11
-
12
-
13
-
14
-
15
-
16
-
17
-
18
-
19
-
20
-
21
-
22
-
23
-
24
-
25
-
26
-
27
-
28
-
29
-
30
-
31
-
32
-
33
-
34
-
35
-
36
-
37
-
38
-
39
-
40
-
41
-
42
-
43
-
44
-
45
-
46
-
47
-
48
-
49
-
50
-
51
-
52
-
53
-
54
-
55
-
56
-
57
-
58
-
59
-
60
-
61
-
62
-
63
-
64
-
65
-
66
-
67
-
68
-
69
-
70
-
71
-
72
-
73
-
74
-
75
-
76
-
77
-
78
-
79
-
80
-
81
-
82
-
83
-
84
-
85
-
86
-
87
-
88
-
89
-
90
-
91
-
92
-
 93
93 -
 94
94 -
 95
95 -
 96
96 -
 97
97 -
 98
98 -
 99
99 -
 100
100 -
 101
101 -
 102
102 -
 103
103 -
 104
104 -
 105
105 -
 106
106 -
 107
107 -
 108
108 -
 109
109 -
 110
110 -
 111
111 -
 112
112 -
 113
113 -
114
-
115
-
116
-
117
-
118
-
119
-
120
-
121
-
122
-
123
-
124
 |
 |

Toyota Global Vision President’s Message Launching a New Structure Special Feature Review of Operations
Consolidated Performance
Highlights
Management and
Corporate Information Investor InformationFinancial Section
Page 103
NextPrev
ContentsSearchPrint
ANNUAL REPORT 2013
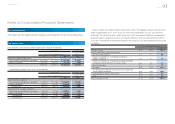
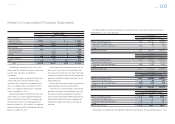
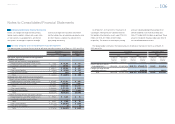
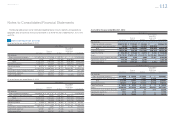
Components of the net periodic pension cost are as follows:
Yen in millions U.S. dollars in millions
For the years ended March 31,
For the year ended
March 31,
2011 2012 2013 2013
Service cost ¥21,288 ¥21,298 ¥27,943 $297
Interest cost 20,720 21,739 24,300 258
Expected return on plan assets (21,164) (22,864) (23,177) (246)
Amortization of prior service costs 389 351 369 4
Recognized net actuarial loss 1,066 1,783 2,884 31
Amortization of net transition obligation — — ——
Net periodic pension cost ¥22,299 ¥22,307 ¥32,319 $344
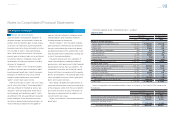
Other changes in plan assets and benefi t obligations recognized in other comprehensive income (loss) are
as follows:
Yen in millions U.S. dollars in millions
For the years ended March 31,
For the year ended
March 31,
2011 2012 2013 2013
Net actuarial loss ¥ (6,244) ¥(58,270) ¥(15,804) $(168)
Recognized net actuarial loss 1,066 1,783 2,884 31
Prior service costs 142 (108) 43 0
Amortization of prior service costs 389 351 369 4
Amortization of net transition obligation — — ——
Other 30,466 5,888 (8,162) (87)
Total recognized in other
comprehensive income (loss) ¥25,819 ¥(50,356) ¥(20,670) $(220)
The other amount includes the impact of consoli-
dation and deconsolidation of certain entities due to
changes in ownership interest and currency transla-
tion adjustments during the years ended March 31,
2011, 2012 and 2013.
The estimated prior service costs and net actuari-
al loss that will be amortized from accumulated
other comprehensive income (loss) into net periodic
pension cost during the year ending March 31,
2014 are ¥300 million ($3 million) and ¥4,400 million
($47 million), respectively.
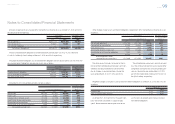
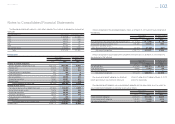
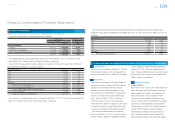
Weighted-average assumptions used to determine benefi t obligations as of March 31, 2012 and 2013 are
as follows:
March 31,
2012 2013
Discount rate 5.0% 4.5%
Rate of compensation increase 4.5% 4.6%
Weighted-average assumptions used to determine net periodic pension cost for the years ended March 31,
2011, 2012 and 2013 are as follows:
For the years ended March 31,
2011 2012 2013
Discount rate 6.2% 5.7% 5.0%
Expected return on plan assets 7.4% 7.3% 7.0%
Rate of compensation increase 4.5% 4.4% 4.5%
The expected rate of return on plan assets is
determined after considering several applicable
factors including, the composition of plan assets
held, assumed risks of asset management, histori-
cal results of the returns on plan assets, Toyota’s
principal policy for plan asset management, and
forecasted market conditions.
Toyota’s policy and objective for plan asset man-
agement is to maximize returns on plan assets to
meet future benefi t payment requirements under
risks which Toyota considers permissible. Asset
allocations under the plan asset management are
determined based on plan asset management poli-
cies of each plan which are established to achieve
the optimized asset compositions in terms of the
long-term overall plan asset management.
Excepting equity securities contributed by Toyota,
approximately 60% of the plan assets is invested in
equity securities, approximately 30% is invested in
debt securities, and the rest of them is invested in
other products. When actual allocations are not in
line with target allocations, Toyota rebalances its
investments in accordance with the policies. Prior to
making individual investments, Toyota performs in-
depth assessments of corresponding factors includ-
ing category of products, industry type, currencies
and liquidity of each potential investment under
consideration to mitigate concentrations of risks
such as market risk and foreign currency exchange
rate risk. To assess performance of the investments,
Toyota establishes bench mark return rates for each
individual investment, combines these individual
bench mark rates based on the asset composition
ratios within each asset category, and compares the
combined rates with the corresponding actual
return rates on each asset category.
Notes to Consolidated Financial Statements
Selected Financial Summary (U.S. GAAP) Consolidated Segment Information Consolidated Quarterly Financial Summary Management’s Discussion and Analysis of Financial Condition and Results of Operations Consolidated Financial Statements Notes to Consolidated Financial Statements [26 of 44]
Management’s Annual Report on Internal Control over Financial Reporting Report of Independent Registered Public Accounting Firm