Toyota 2013 Annual Report Download - page 77
Download and view the complete annual report
Please find page 77 of the 2013 Toyota annual report below. You can navigate through the pages in the report by either clicking on the pages listed below, or by using the keyword search tool below to find specific information within the annual report.-
 1
1 -
2
-
3
-
4
-
5
-
6
-
7
-
8
-
9
-
10
-
11
-
12
-
13
-
14
-
15
-
16
-
17
-
18
-
19
-
20
-
21
-
22
-
23
-
24
-
25
-
26
-
27
-
28
-
29
-
30
-
31
-
32
-
33
-
34
-
35
-
36
-
37
-
38
-
39
-
40
-
41
-
42
-
43
-
44
-
45
-
46
-
47
-
48
-
49
-
50
-
51
-
52
-
53
-
54
-
55
-
56
-
57
-
58
-
59
-
60
-
61
-
62
-
63
-
64
-
65
-
66
-
 67
67 -
 68
68 -
 69
69 -
 70
70 -
 71
71 -
 72
72 -
 73
73 -
 74
74 -
 75
75 -
 76
76 -
 77
77 -
 78
78 -
 79
79 -
 80
80 -
 81
81 -
 82
82 -
 83
83 -
 84
84 -
 85
85 -
 86
86 -
 87
87 -
88
-
89
-
90
-
91
-
92
-
93
-
94
-
95
-
96
-
97
-
98
-
99
-
100
-
101
-
102
-
103
-
104
-
105
-
106
-
107
-
108
-
109
-
110
-
111
-
112
-
113
-
114
-
115
-
116
-
117
-
118
-
119
-
120
-
121
-
122
-
123
-
124
 |
 |

Toyota Global Vision President’s Message Launching a New Structure Special Feature Review of Operations
Consolidated Performance
Highlights
Management and
Corporate Information Investor InformationFinancial Section
Page 77
NextPrev
ContentsSearchPrint
ANNUAL REPORT 2013
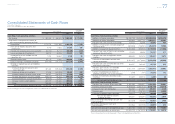
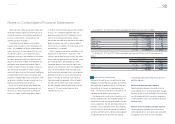
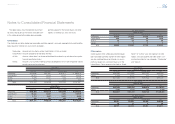
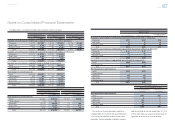
Consolidated Statements of Cash Flows
Toyota Motor Corporation
For the years ended March 31, 2011, 2012 and 2013
Yen in millions
U.S. dollars
in millions
2011 2012 2013 2013
Cash fl ows from operating activities
Net income ¥ 465,485 ¥ 368,302 ¥ 1,083,482 $ 11,520
Adjustments to reconcile net income to
net cash provided by operating activities
Depreciation 1,175,573 1,067,830 1,105,109 11,750
Provision for doubtful accounts and
credit losses 4,140 9,623 27,367 291
Pension and severance costs, less payments (23,414) 16,711 (20,429) (217)
Losses on disposal of fi xed assets 36,214 33,528 32,221 343
Unrealized losses on available-for-sale
securities, net 7,915 53,831 2,104 22
Deferred income taxes 85,710 6,395 160,008 1,701
Equity in earnings of affi liated companies (215,016) (197,701) (231,519) (2,461)
Changes in operating assets and liabilities,
and other
(Increase) decrease in accounts and
notes receivable 421,423 (585,464) (168,260) (1,789)
(Increase) decrease in inventories 51,808 (344,923) 50,483 537
(Increase) decrease in other current assets 38,307 (180,529) (47,033) (500)
Increase (decrease) in accounts payable (406,210) 756,363 (209,284) (2,225)
Increase (decrease) in accrued income taxes (40,629) 20,943 22,127 235
Increase in other current liabilities 239,319 316,366 280,083 2,978
Other 183,384 111,160 364,857 3,879
Net cash provided by operating activities ¥ 2,024,009 ¥ 1,452,435 ¥ 2,451,316 $ 26,064
Yen in millions
U.S. dollars
in millions
2011 2012 2013 2013
Cash fl ows from investing activities
Additions to fi nance receivables ¥(8,438,785) ¥(8,333,248) ¥(10,004,928) $(106,379)
Collection of fi nance receivables 7,934,364 8,007,711 9,063,011 96,364
Proceeds from sales of fi nance receivables 69,576 53,999 39,845 424
Additions to fi xed assets excluding equipment
leased to others (629,326) (723,537) (854,561) (9,086)
Additions to equipment leased to others (1,061,865) (808,545) (1,119,591) (11,904)
Proceeds from sales of fi xed assets excluding
equipment leased to others 51,342 36,633 39,191 417
Proceeds from sales of equipment leased
to others 486,695 431,313 533,441 5,672
Purchases of marketable securities and
security investments (4,421,807) (3,173,634) (3,412,423) (36,283)
Proceeds from sales of marketable securities
and security investments 189,037 162,160 35,178 374
Proceeds upon maturity of marketable
securities and security investments 3,527,119 2,694,665 2,633,913 28,005
Payment for additional investments in
affi liated companies, net of cash acquired (299) (147) 16,216 172
Changes in investments and other assets,
and other 177,605 209,972 3,396 36
Net cash used in investing activities (2,116,344) (1,442,658) (3,027,312) (32,188)
Cash fl ows from fi nancing activities
Proceeds from issuance of long-term debt 2,931,436 2,394,807 3,191,223 33,931
Payments of long-term debt (2,489,632) (2,867,572) (2,682,136) (28,518)
Increase in short-term borrowings 162,260 311,651 201,261 2,139
Dividends paid (141,120) (156,785) (190,008) (2,020)
Purchase of common stock, and other (28,617) (37,448) (43,098) (458)
Net cash provided by (used in)
fi nancing activities 434,327 (355,347) 477,242 5,074
Effect of exchange rate changes on cash and
cash equivalents (127,029) (55,939) 137,851 1,466
Net increase (decrease) in cash and
cash equivalents 214,963 (401,509) 39,097 416
Cash and cash equivalents at beginning of year 1,865,746 2,080,709 1,679,200 17,854
Cash and cash equivalents at end of year ¥ 2,080,709 ¥ 1,679,200 ¥ 1,718,297 $ 18,270
The accompanying notes are an integral part of these consolidated fi nancial statements.
The accompanying notes are an integral part of these consolidated fi nancial statements.
Selected Financial Summary (U.S. GAAP) Consolidated Segment Information Consolidated Quarterly Financial Summary Management’s Discussion and Analysis of Financial Condition and Results of Operations Consolidated Financial Statements [6 of 6] Notes to Consolidated Financial Statements
Management’s Annual Report on Internal Control over Financial Reporting Report of Independent Registered Public Accounting Firm