Toyota 2013 Annual Report Download - page 120
Download and view the complete annual report
Please find page 120 of the 2013 Toyota annual report below. You can navigate through the pages in the report by either clicking on the pages listed below, or by using the keyword search tool below to find specific information within the annual report.-
 1
1 -
2
-
3
-
4
-
5
-
6
-
7
-
8
-
9
-
10
-
11
-
12
-
13
-
14
-
15
-
16
-
17
-
18
-
19
-
20
-
21
-
22
-
23
-
24
-
25
-
26
-
27
-
28
-
29
-
30
-
31
-
32
-
33
-
34
-
35
-
36
-
37
-
38
-
39
-
40
-
41
-
42
-
43
-
44
-
45
-
46
-
47
-
48
-
49
-
50
-
51
-
52
-
53
-
54
-
55
-
56
-
57
-
58
-
59
-
60
-
61
-
62
-
63
-
64
-
65
-
66
-
67
-
68
-
69
-
70
-
71
-
72
-
73
-
74
-
75
-
76
-
77
-
78
-
79
-
80
-
81
-
82
-
83
-
84
-
85
-
86
-
87
-
88
-
89
-
90
-
91
-
92
-
93
-
94
-
95
-
96
-
97
-
98
-
99
-
100
-
101
-
102
-
103
-
104
-
105
-
106
-
107
-
108
-
109
-
 110
110 -
 111
111 -
 112
112 -
 113
113 -
 114
114 -
 115
115 -
 116
116 -
 117
117 -
 118
118 -
 119
119 -
 120
120 -
 121
121 -
 122
122 -
 123
123 -
 124
124
 |
 |

Toyota Global Vision President’s Message Launching a New Structure Special Feature Review of Operations
Consolidated Performance
Highlights
Management and
Corporate Information Investor InformationFinancial Section
Page 120
NextPrev
ContentsSearchPrint
ANNUAL REPORT 2013
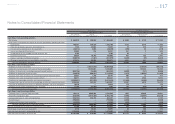
The following is description of the assets and lia-
bilities measured at fair value, information about the
valuation techniques used to measure fair value, key
inputs and signifi cant assumption:
Cash equivalents and time deposits
Cash equivalents include money market funds and
other investments with original maturities of three
months or less. Cash equivalents classifi
ed in Level
2 include primarily negotiable certifi cate of deposit
with original maturities of three months or less.
These are measured at fair value using observable
interest rates in the market. Time deposits include
negotiable certifi cate of deposit with original maturi-
ties over three months. These are measured at fair
value using observable interest rates in the market.
Marketable securities and
other securities investments
Marketable securities and other securities invest-
ments include public and corporate bonds, com-
mon stocks and other investments. Public and
corporate bonds include primarily government
bonds and represent 60% of Japanese bonds, and
40% of U.S., European and other bonds as of
March 31, 2012, and 49% of Japanese bonds, and
51% of U.S., European and other bonds as of
March 31, 2013. Listed stocks on the Japanese
stock markets represent 83% and 85% of common
stocks as of March 31, 2012 and 2013,
respectively. Toyota uses primarily quoted market
prices for identical assets to measure fair value of
these securities. “Other” includes primarily invest-
ment trusts. Generally, Toyota uses quoted market
prices for similar assets or quoted non-active mar-
ket prices for identical assets to measure fair value
of these securities. These assets are classifi ed in
Level 2.
Derivative fi nancial instruments
See note 20 to the consolidated fi nancial state-
ments about derivative fi nancial instruments. Toyota
estimates the fair value of derivative fi nancial instru-
ments using industry-standard valuation models
that require observable inputs including interest
rates and foreign exchange rates, and the contrac-
tual terms. The usage of these models does not
require signifi cant judgment to be applied. These
derivative fi nancial instruments are classifi ed in Level
2. In other certain cases when market data is not
available, key inputs to the fair value measurement
include quotes from counterparties, and other mar-
ket data. Toyota assesses the reasonableness of
changes of the quotes using observable market
data. These derivative fi nancial instruments are clas-
sifi ed in Level 3. Toyota’s derivative fair value mea-
surements consider assumptions about
counterparty and our own non-performance risk,
using such as credit default probabilities.
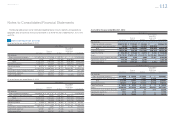
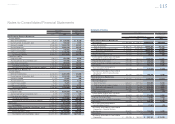
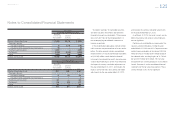
The following table summarizes the changes in Level 3 assets and liabilities measured at fair value on
a recurring basis for the periods ended March 31, 2011, 2012 and 2013:
Yen in millions
For the year ended March 31, 2011
Marketable
securities and
other securities
investments
Derivative
fi nancial
instruments Total
Balance at beginning of year ¥13,134 ¥ 5,892 ¥19,026
Total gains (losses)
Included in earnings 433 31,338 31,771
Included in other comprehensive income (loss) 779 — 779
Purchases, issuances and settlements (810) (8,381) (9,191)
Other (13,536) (22,055) (35,591)
Balance at end of year ¥ — ¥ 6,794 ¥ 6,794
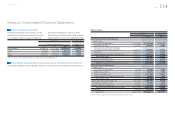
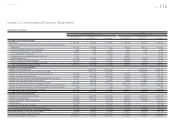
Yen in millions
For the year ended March 31, 2012
Marketable
securities and
other securities
investments
Derivative
fi nancial
instruments Total
Balance at beginning of year ¥ — ¥6,794 ¥6,794
Total gains (losses)
Included in earnings — 6,476 6,476
Included in other comprehensive income (loss) — — —
Purchases and issuances — — —
Settlements — (3,832) (3,832)
Other 1,684 (4,699) (3,015)
Balance at end of year ¥1,684 ¥4,739 ¥6,423
Notes to Consolidated Financial Statements
Selected Financial Summary (U.S. GAAP) Consolidated Segment Information Consolidated Quarterly Financial Summary Management’s Discussion and Analysis of Financial Condition and Results of Operations Consolidated Financial Statements Notes to Consolidated Financial Statements [43 of 44]
Management’s Annual Report on Internal Control over Financial Reporting Report of Independent Registered Public Accounting Firm