Toyota 2013 Annual Report Download - page 64
Download and view the complete annual report
Please find page 64 of the 2013 Toyota annual report below. You can navigate through the pages in the report by either clicking on the pages listed below, or by using the keyword search tool below to find specific information within the annual report.-
 1
1 -
2
-
3
-
4
-
5
-
6
-
7
-
8
-
9
-
10
-
11
-
12
-
13
-
14
-
15
-
16
-
17
-
18
-
19
-
20
-
21
-
22
-
23
-
24
-
25
-
26
-
27
-
28
-
29
-
30
-
31
-
32
-
33
-
34
-
35
-
36
-
37
-
38
-
39
-
40
-
41
-
42
-
43
-
44
-
45
-
46
-
47
-
48
-
49
-
50
-
51
-
52
-
53
-
 54
54 -
 55
55 -
 56
56 -
 57
57 -
 58
58 -
 59
59 -
 60
60 -
 61
61 -
 62
62 -
 63
63 -
 64
64 -
 65
65 -
 66
66 -
 67
67 -
 68
68 -
 69
69 -
 70
70 -
 71
71 -
 72
72 -
 73
73 -
 74
74 -
75
-
76
-
77
-
78
-
79
-
80
-
81
-
82
-
83
-
84
-
85
-
86
-
87
-
88
-
89
-
90
-
91
-
92
-
93
-
94
-
95
-
96
-
97
-
98
-
99
-
100
-
101
-
102
-
103
-
104
-
105
-
106
-
107
-
108
-
109
-
110
-
111
-
112
-
113
-
114
-
115
-
116
-
117
-
118
-
119
-
120
-
121
-
122
-
123
-
124
 |
 |

Toyota Global Vision President’s Message Launching a New Structure Special Feature Review of Operations
Consolidated Performance
Highlights
Management and
Corporate Information Investor InformationFinancial Section
Page 64
NextPrev
ContentsSearchPrint
ANNUAL REPORT 2013
In fi scal 2014, Toyota expects to suffi ciently fund
its capital expenditures and research and develop-
ment activities through cash and cash equivalents
on hand, and cash generated by operations. Toyota
will use its funds for the development of environ-
ment technologies, maintenance and replacement
of manufacturing facilities, and the introduction of
new products. See “Information on the Company—
Business Overview—Capital Expenditures and
Divestitures” in Toyota’s annual report on Form-20F
for information regarding Toyota’s material capital
expenditures and divestitures for fi scal 2011, 2012
and 2013, and information concerning Toyota’s
principal capital expenditures and divestitures cur-
rently in progress.
Toyota funds its fi nancing programs for custom-
ers and dealers, including loans and leasing pro-
grams, from both cash generated by operations
and borrowings by its sales fi nance subsidiaries.
Toyota seeks to expand its ability to raise funds
locally in markets throughout the world by expand-
ing its network of fi nance subsidiaries.
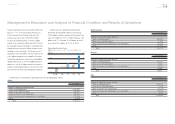
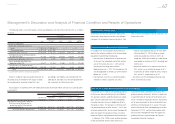
Net cash provided by operating activities
increased by ¥998.8 billion to ¥2,451.3 billion for
fi scal 2013, compared with ¥1,452.4 billion for fi scal
2012. The increase was primarily attributable to the
¥965.2 billion increase in operating income. See
“Results of Operations—Fiscal 2013 Compared
with Fiscal 2012—Operating income” for further
information regarding the increase in operating income.
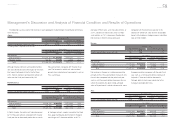
Net cash provided by operating activities
decreased by ¥571.5 billion to ¥1,452.4 billion for
fi scal 2012, compared with ¥2,024.0 billion for fi scal
2011. The decrease was primarily attributable to the
¥112.6 billion decrease in operating income, to
a decline in depreciation expense of ¥107.7 billion
and a reduction in inventory.
Even though other working capital items signifi -
cantly fl uctuated in line with the signifi cant decrease
in production and sales in March 2011 due to the
Great East Japan Earthquake and increase in sales
in the second half of fi scal 2012 due to the recovery
of production levels from the Great East Japan
Earthquake, changes in other working capital items
largely offset each other such that Toyota believes
the impact of such changes on net cash provided
by operating activities was not material. The impact
of changes in interest and other items on net cash
provided by operating activities were also not material.
Inventory levels were at comparable levels as
between the ends of fi scal 2010 and 2011; while
the reduction in sales after the Lehman fi nancial cri-
sis and other factors kept the inventory level low at
the end of fi scal 2010, the inventory level at the end
of fi scal 2011 was approximately equivalent
because of the Great East Japan Earthquake and
the subsequent downturn in production. However,
the inventory level at the end of fi scal 2012
increased due to the recovery of production and
sales after the Great East Japan Earthquake. This
increase of inventory involved related expenditures
incurred in producing the inventory, which resulted
in reducing the net cash provided by operating
activities by ¥396.7 billion.
Furthermore, depreciation decreased by ¥107.7
billion in fi scal 2012 as a result of a reduction of
Toyota’s capital expenditures after the Lehman
fi nancial crisis compared with capital expenditures
before such fi nancial crisis. The decrease in depre-
ciation favorably affected net income while it did not
affect the net cash provided by operating activities.
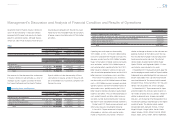
Net cash used in investing activities increased by
¥1,584.6 billion to ¥3,027.3 billion for fi scal 2013,
compared with ¥1,442.6 billion for fi scal 2012. The
increase was primarily attributable to the ¥630.5 bil-
lion increase in fi nance receivables, to the ¥426.5
billion increase in marketable securities and security
investments and to the ¥311.0 billion increase in
purchases of investments in property.
Net cash used in investing activities decreased by
¥673.6 billion to ¥1,442.6 billion for fi scal 2012,
compared with ¥2,116.3 billion for fi scal 2011. The
decrease was primarily attributable to the ¥1,248.1
billion decrease in purchases of marketable securi-
ties and security investments, partially offset by a
¥859.3 billion decrease in sales and maturity of
marketable securities and security investments.
Net cash provided by or used in fi nancing activities
increased by ¥832.5 billion to ¥477.2 billion increase
for fi scal 2013, compared with ¥355.3 billion decrease
for fi scal 2012. The increase was primarily attribut-
able to the ¥796.4 billion increase in proceeds from
issuance of long-term debt and to the ¥185.4 billion
decrease in payments of long-term debt.
Net cash provided by or used in fi nancing activi-
ties decreased by ¥789.6 billion to ¥355.3 billion
decrease for fi scal 2012, compared with ¥434.3 billion
increase for fi scal 2011. The decrease was primarily
attributable to the ¥536.6 billion decrease in proceeds
from issuance of long-term debt and to the ¥377.9 bil-
lion increase in payments of long-term debt.
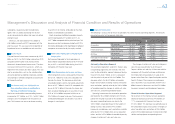
Total capital expenditures for property, plant and
equipment, excluding vehicles and equipment on
operating leases, were ¥854.5 billion during fi scal
2013, an increase of 18.1% over the ¥723.5 billion
in total capital expenditures during the prior fi scal
year. This increase was due primarily to an increase
of investments in North America and Asia.
Total capital expenditures for vehicles and equip-
ment on operating leases were ¥1,119.5 billion dur-
ing fi scal 2013, an increase of 38.5% over the
¥808.5 billion in expenditures from the prior fi scal
year. This increase was due to an increase in invest-
ments in the fi nancial services operations.
Toyota expects investments in property, plant and
equipment, excluding vehicles and equipment on
operating leases, to be approximately ¥910.0 billion
during fi scal 2014.
Based on currently available information, Toyota
does not expect environmental matters to have a
material impact on its fi nancial position, results of
operations, liquidity or cash fl ows during fi scal
2014. However, uncertainty exists with respect to
Toyota’s obligations under current and future envi-
ronment regulations as described in “Information on
the Company—Business Overview—Governmental
Regulation, Environmental and Safety Standards” in
Toyota’s annual report on Form 20-F.
Cash and cash equivalents were ¥1,718.2 billion
as of March 31, 2013. Most of Toyota’s cash and
cash equivalents are held in the Japanese yen or in
the U.S. dollars. In addition, time deposits were
¥106.7 billion and marketable securities were
¥1,445.6 billion as of March 31, 2013.
Management’s Discussion and Analysis of Financial Condition and Results of Operations
Selected Financial Summary (U.S. GAAP) Consolidated Segment Information Consolidated Quarterly Financial Summary Management’s Discussion and Analysis of Financial Condition and Results of Operations [19 of 26] Consolidated Financial Statements Notes to Consolidated Financial Statements
Management’s Annual Report on Internal Control over Financial Reporting Report of Independent Registered Public Accounting Firm