Toyota 2013 Annual Report Download - page 117
Download and view the complete annual report
Please find page 117 of the 2013 Toyota annual report below. You can navigate through the pages in the report by either clicking on the pages listed below, or by using the keyword search tool below to find specific information within the annual report.-
 1
1 -
2
-
3
-
4
-
5
-
6
-
7
-
8
-
9
-
10
-
11
-
12
-
13
-
14
-
15
-
16
-
17
-
18
-
19
-
20
-
21
-
22
-
23
-
24
-
25
-
26
-
27
-
28
-
29
-
30
-
31
-
32
-
33
-
34
-
35
-
36
-
37
-
38
-
39
-
40
-
41
-
42
-
43
-
44
-
45
-
46
-
47
-
48
-
49
-
50
-
51
-
52
-
53
-
54
-
55
-
56
-
57
-
58
-
59
-
60
-
61
-
62
-
63
-
64
-
65
-
66
-
67
-
68
-
69
-
70
-
71
-
72
-
73
-
74
-
75
-
76
-
77
-
78
-
79
-
80
-
81
-
82
-
83
-
84
-
85
-
86
-
87
-
88
-
89
-
90
-
91
-
92
-
93
-
94
-
95
-
96
-
97
-
98
-
99
-
100
-
101
-
102
-
103
-
104
-
105
-
106
-
 107
107 -
 108
108 -
 109
109 -
 110
110 -
 111
111 -
 112
112 -
 113
113 -
 114
114 -
 115
115 -
 116
116 -
 117
117 -
 118
118 -
 119
119 -
 120
120 -
 121
121 -
 122
122 -
 123
123 -
 124
124
 |
 |
Toyota Global Vision President’s Message Launching a New Structure Special Feature Review of Operations
Consolidated Performance
Highlights
Management and
Corporate Information Investor InformationFinancial Section
Page 117
NextPrev
ContentsSearchPrint
ANNUAL REPORT 2013
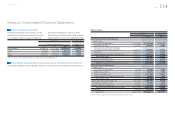
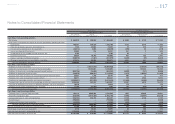
Yen in millions U.S. dollars in millions
For the year ended March 31, 2013 For the year ended March 31, 2013
Non-Financial
Services Businesses
Financial
Services Businesses Consolidated
Non-Financial
Services Businesses
Financial Services
Businesses Consolidated
Cash fl ows from operating activities
Net income ¥ 883,073 ¥ 200,258 ¥ 1,083,482 $ 9,389 $ 2,129 $ 11,520
Adjustments to reconcile net income to net cash provided by operating activities
Depreciation 768,581 336,528 1,105,109 8,172 3,578 11,750
Provision for doubtful accounts and credit losses 1,745 25,622 27,367 19 272 291
Pension and severance costs, less payments (23,514) 3,085 (20,429) (250) 33 (217)
Losses on disposal of fi xed assets 32,005 216 32,221 341 2 343
Unrealized losses on available-for-sale securities, net 2,104 — 2,104 22 — 22
Deferred income taxes 89,834 70,743 160,008 955 753 1,701
Equity in earnings of affi liated companies (230,078) (1,441) (231,519) (2,446) (15) (2,461)
Changes in operating assets and liabilities, and other 472,514 32,066 292,973 5,024 341 3,115
Net cash provided by operating activities 1,996,264 667,077 2,451,316 21,226 7,093 26,064
Cash fl ows from investing activities
Additions to fi nance receivables — (16,877,678) (10,004,928) — (179,454) (106,379)
Collection of and proceeds from sales of fi nance receivables — 15,784,681 9,102,856 — 167,832 96,788
Additions to fi xed assets excluding equipment leased to others (839,756) (14,805) (854,561) (8,929) (157) (9,086)
Additions to equipment leased to others (129,070) (990,521) (1,119,591) (1,372) (10,532) (11,904)
Proceeds from sales of fi xed assets excluding equipment leased to others 38,051 1,140 39,191 405 12 417
Proceeds from sales of equipment leased to others 68,571 464,870 533,441 729 4,943 5,672
Purchases of marketable securities and security investments (2,980,821) (431,602) (3,412,423) (31,694) (4,589) (36,283)
Proceeds from sales of and maturity of marketable securities and security investments 2,285,566 383,525 2,669,091 24,301 4,078 28,379
Payment for additional investments in affi liated companies, net of cash acquired 16,216 — 16,216 172 — 172
Changes in investments and other assets, and other 17,206 (77,848) 3,396 183 (828) 36
Net cash used in investing activities (1,524,037) (1,758,238) (3,027,312) (16,205) (18,695) (32,188)
Cash fl ows from fi nancing activities
Proceeds from issuance of long-term debt 182,114 3,089,484 3,191,223 1,937 32,849 33,931
Payments of long-term debt (328,380) (2,415,566) (2,682,136) (3,492) (25,684) (28,518)
Increase (decrease) in short-term borrowings (162,782) 388,416 201,261 (1,731) 4,130 2,139
Dividends paid (190,008) — (190,008) (2,020) — (2,020)
Purchase of common stock, and other (43,098) — (43,098) (458) — (458)
Net cash provided (used in) fi nancing activities (542,154) 1,062,334 477,242 (5,764) 11,295 5,074
Effect of exchange rate changes on cash and cash equivalents 72,700 65,151 137,851 773 693 1,466
Net increase in cash and cash equivalents 2,773 36,324 39,097 30 386 416
Cash and cash equivalents at beginning of year 1,104,636 574,564 1,679,200 11,745 6,109 17,854
Cash and cash equivalents at end of year ¥1,107,409 ¥ 610,888 ¥ 1,718,297 $11,775 $ 6,495 $ 18,270
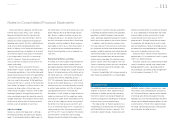
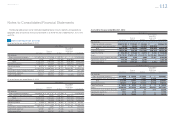
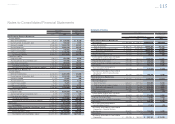
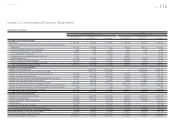
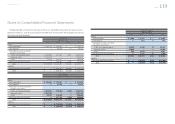
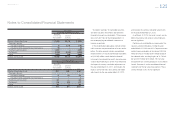
Notes to Consolidated Financial Statements
Selected Financial Summary (U.S. GAAP) Consolidated Segment Information Consolidated Quarterly Financial Summary Management’s Discussion and Analysis of Financial Condition and Results of Operations Consolidated Financial Statements Notes to Consolidated Financial Statements [40 of 44]
Management’s Annual Report on Internal Control over Financial Reporting Report of Independent Registered Public Accounting Firm