Toyota 2013 Annual Report Download - page 85
Download and view the complete annual report
Please find page 85 of the 2013 Toyota annual report below. You can navigate through the pages in the report by either clicking on the pages listed below, or by using the keyword search tool below to find specific information within the annual report.-
 1
1 -
2
-
3
-
4
-
5
-
6
-
7
-
8
-
9
-
10
-
11
-
12
-
13
-
14
-
15
-
16
-
17
-
18
-
19
-
20
-
21
-
22
-
23
-
24
-
25
-
26
-
27
-
28
-
29
-
30
-
31
-
32
-
33
-
34
-
35
-
36
-
37
-
38
-
39
-
40
-
41
-
42
-
43
-
44
-
45
-
46
-
47
-
48
-
49
-
50
-
51
-
52
-
53
-
54
-
55
-
56
-
57
-
58
-
59
-
60
-
61
-
62
-
63
-
64
-
65
-
66
-
67
-
68
-
69
-
70
-
71
-
72
-
73
-
74
-
 75
75 -
 76
76 -
 77
77 -
 78
78 -
 79
79 -
 80
80 -
 81
81 -
 82
82 -
 83
83 -
 84
84 -
 85
85 -
 86
86 -
 87
87 -
 88
88 -
 89
89 -
 90
90 -
 91
91 -
 92
92 -
 93
93 -
 94
94 -
 95
95 -
96
-
97
-
98
-
99
-
100
-
101
-
102
-
103
-
104
-
105
-
106
-
107
-
108
-
109
-
110
-
111
-
112
-
113
-
114
-
115
-
116
-
117
-
118
-
119
-
120
-
121
-
122
-
123
-
124
 |
 |

Toyota Global Vision President’s Message Launching a New Structure Special Feature Review of Operations
Consolidated Performance
Highlights
Management and
Corporate Information Investor InformationFinancial Section
Page 85
NextPrev
ContentsSearchPrint
ANNUAL REPORT 2013
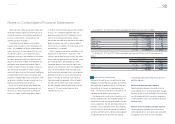
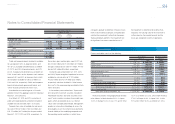
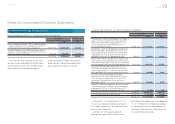
The contractual maturities of retail receivables, the future minimum lease payments on fi nance leases and
the contractual maturities of wholesale and other dealer loans at March 31, 2013 are summarized as follows:
Yen in millions U.S. dollars in millions
Years ending March 31, Retail Finance leases
Wholesale and
other dealer loans Retail Finance leases
Wholesale and
other dealer loans
2014 ¥3,032,542 ¥285,324 ¥2,040,442 $32,244 $3,034 $21,695
2015 2,218,871 192,978 149,091 23,593 2,052 1,585
2016 1,721,430 162,639 115,640 18,303 1,729 1,230
2017 1,127,558 65,767 125,180 11,989 699 1,331
2018 609,255 29,716 119,497 6,478 316 1,271
Thereafter 338,126 6,447 65,878 3,595 69 700
¥9,047,782 ¥742,871 ¥2,615,728 $96,202 $7,899 $27,812
Finance leases consist of the following:
Yen in millions U.S. dollars in millions
March 31, March 31,
2012 2013 2013
Minimum lease payments ¥688,642 ¥ 742,871 $ 7,899
Estimated unguaranteed residual values 266,788 287,016 3,051
955,430 1,029,887 10,950
Deferred origination costs 3,722 3,577 38
Less—Unearned income (90,887) (87,537) (931)
Less—Allowance for credit losses (30,637) (28,928) (307)
Finance leases, net ¥837,628 ¥ 916,999 $ 9,750
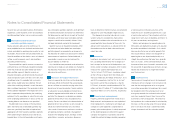
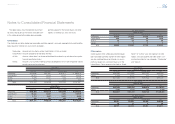
Toyota is exposed to credit risk on Toyota’s
fi nance receivables. Credit risk is the risk of loss
arising from the failure of customers or dealers to
meet the terms of their contracts with
Toyota or otherwise fail to perform as agreed.
Toyota estimates allowance for credit losses by vari-
ety of credit-risk evaluation process to cover proba-
ble and estimable losses above.
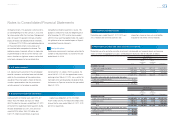
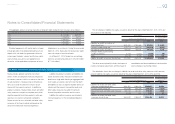
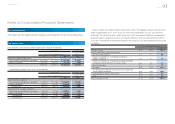
The table below shows the amount of the fi nance receivables segregated into aging categories based on
the number of days outstanding as of March 31, 2012 and 2013:
Yen in millions
March 31, 2012
Retail Finance leases Wholesale Real estate Working capital
Current ¥7,146,365 ¥939,345 ¥923,642 ¥535,296 ¥574,671
31-60 days past due 64,314 5,766 3 — 70
61-90 days past due 13,851 2,645 — — —
Over 90 days past due 24,263 7,674 53 98 121
Total ¥7,248,793 ¥955,430 ¥923,698 ¥535,394 ¥574,862
Yen in millions
March 31, 2013
Retail Finance leases Wholesale Real estate Working capital
Current ¥8,923,588 ¥1,021,074 ¥1,305,953 ¥658,114 ¥651,553
31-60 days past due 84,354 3,106 45 63 —
61-90 days past due 17,312 1,661 — — —
Over 90 days past due 22,528 4,046 — — —
Total ¥9,047,782 ¥1,029,887 ¥1,305,998 ¥658,177 ¥651,553
U.S. dollars in millions
March 31, 2013
Retail Finance leases Wholesale Real estate Working capital
Current $94,881 $10,857 $13,886 $6,997 $6,928
31-60 days past due 897 33 0 1 —
61-90 days past due 184 17 — — —
Over 90 days past due 240 43 — — —
Total $96,202 $10,950 $13,886 $6,998 $6,928
Notes to Consolidated Financial Statements
Selected Financial Summary (U.S. GAAP) Consolidated Segment Information Consolidated Quarterly Financial Summary Management’s Discussion and Analysis of Financial Condition and Results of Operations Consolidated Financial Statements Notes to Consolidated Financial Statements [8 of 44]
Management’s Annual Report on Internal Control over Financial Reporting Report of Independent Registered Public Accounting Firm