Toyota 2013 Annual Report Download - page 44
Download and view the complete annual report
Please find page 44 of the 2013 Toyota annual report below. You can navigate through the pages in the report by either clicking on the pages listed below, or by using the keyword search tool below to find specific information within the annual report.-
 1
1 -
2
-
3
-
4
-
5
-
6
-
7
-
8
-
9
-
10
-
11
-
12
-
13
-
14
-
15
-
16
-
17
-
18
-
19
-
20
-
21
-
22
-
23
-
24
-
25
-
26
-
27
-
28
-
29
-
30
-
31
-
32
-
33
-
 34
34 -
 35
35 -
 36
36 -
 37
37 -
 38
38 -
 39
39 -
 40
40 -
 41
41 -
 42
42 -
 43
43 -
 44
44 -
 45
45 -
 46
46 -
 47
47 -
 48
48 -
 49
49 -
 50
50 -
 51
51 -
 52
52 -
 53
53 -
 54
54 -
55
-
56
-
57
-
58
-
59
-
60
-
61
-
62
-
63
-
64
-
65
-
66
-
67
-
68
-
69
-
70
-
71
-
72
-
73
-
74
-
75
-
76
-
77
-
78
-
79
-
80
-
81
-
82
-
83
-
84
-
85
-
86
-
87
-
88
-
89
-
90
-
91
-
92
-
93
-
94
-
95
-
96
-
97
-
98
-
99
-
100
-
101
-
102
-
103
-
104
-
105
-
106
-
107
-
108
-
109
-
110
-
111
-
112
-
113
-
114
-
115
-
116
-
117
-
118
-
119
-
120
-
121
-
122
-
123
-
124
 |
 |

Toyota Global Vision President’s Message Launching a New Structure Special Feature Review of Operations
Consolidated Performance
Highlights
Management and
Corporate Information Investor InformationFinancial Section
Page 44
NextPrev
ContentsSearchPrint
ANNUAL REPORT 2013
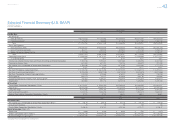
Consolidated Segment Information
Toyota Motor Corporation
Fiscal years ended March 31
Yen in millions % change
2008 2009 2010 2011 2012 2013 2013 vs. 2012
Business Segment:
Net Revenues:
Automotive ¥24,177,306 ¥18,564,723 ¥17,197,428 ¥17,337,320 ¥16,994,546 ¥20,419,100 +20.2
Financial Services 1,498,354 1,377,548 1,245,407 1,192,205 1,100,324 1,170,670 +6.4
All Other 1,346,955 1,184,947 947,615 972,252 1,048,915 1,066,461 +1.7
Intersegment Elimination (733,375) (597,648) (439,477) (508,089) (560,132) (592,039) —
Consolidated ¥26,289,240 ¥20,529,570 ¥18,950,973 ¥18,993,688 ¥18,583,653 ¥22,064,192 +18.7
Operating Income (Loss):
Automotive ¥ 2,171,905 ¥ (394,876) ¥ (86,370) ¥ 85,973 ¥ 21,683 ¥ 944,704 +4,256.9
Financial Services 86,494 (71,947) 246,927 358,280 306,438 315,820 +3.1
All Other 33,080 9,913 (8,860) 35,242 42,062 53,616 +27.5
Intersegment Elimination (21,104) (4,101) (4,181) (11,216) (14,556) 6,748 —
Consolidated ¥ 2,270,375 ¥ (461,011) ¥ 147,516 ¥ 468,279 ¥ 355,627 ¥ 1,320,888 +271.4
Geographic Information:
Net Revenues:
Japan ¥15,315,812 ¥12,186,737 ¥11,220,303 ¥10,986,246 ¥11,167,319 ¥12,821,018 +14.8
North America 9,423,258 6,222,914 5,670,526 5,429,136 4,751,886 6,284,425 +32.3
Europe 3,993,434 3,013,128 2,147,049 1,981,497 1,993,946 2,083,113 +4.5
Asia 3,120,826 2,719,329 2,655,327 3,374,534 3,334,274 4,385,476 +31.5
Other 2,294,137 1,882,900 1,673,861 1,809,116 1,760,175 2,094,265 +19.0
Intersegment Elimination (7,858,227) (5,495,438) (4,416,093) (4,586,841) (4,423,947) (5,604,105) —
Consolidated ¥26,289,240 ¥20,529,570 ¥18,950,973 ¥18,993,688 ¥18,583,653 ¥22,064,192 +18.7
Operating Income (Loss):
Japan ¥ 1,440,286 ¥ (237,531) ¥ (225,242) ¥ (362,396) ¥ (207,040) ¥ 576,335 —
North America 305,352 (390,192) 85,490 339,503 186,409 221,925 +19.1
Europe 141,571 (143,233) (32,955) 13,148 17,796 26,462 +48.7
Asia 256,356 176,060 203,527 312,977 256,790 376,055 +46.4
Other 143,978 87,648 115,574 160,129 108,814 133,744 +22.9
Intersegment Elimination (17,168) 46,237 1,122 4,918 (7,142) (13,633) —
Consolidated ¥ 2,270,375 ¥ (461,011) ¥ 147,516 ¥ 468,279 ¥ 355,627 ¥ 1,320,888 +271.4
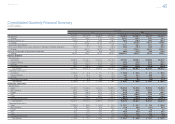
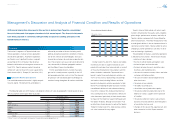
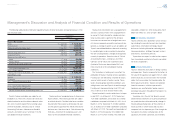
Selected Financial Summary (U.S. GAAP) Consolidated Segment Information Consolidated Quarterly Financial Summary Management’s Discussion and Analysis of Financial Condition and Results of Operations Consolidated Financial Statements Notes to Consolidated Financial Statements
Management’s Annual Report on Internal Control over Financial Reporting Report of Independent Registered Public Accounting Firm