Toyota 2013 Annual Report Download - page 108
Download and view the complete annual report
Please find page 108 of the 2013 Toyota annual report below. You can navigate through the pages in the report by either clicking on the pages listed below, or by using the keyword search tool below to find specific information within the annual report.-
 1
1 -
2
-
3
-
4
-
5
-
6
-
7
-
8
-
9
-
10
-
11
-
12
-
13
-
14
-
15
-
16
-
17
-
18
-
19
-
20
-
21
-
22
-
23
-
24
-
25
-
26
-
27
-
28
-
29
-
30
-
31
-
32
-
33
-
34
-
35
-
36
-
37
-
38
-
39
-
40
-
41
-
42
-
43
-
44
-
45
-
46
-
47
-
48
-
49
-
50
-
51
-
52
-
53
-
54
-
55
-
56
-
57
-
58
-
59
-
60
-
61
-
62
-
63
-
64
-
65
-
66
-
67
-
68
-
69
-
70
-
71
-
72
-
73
-
74
-
75
-
76
-
77
-
78
-
79
-
80
-
81
-
82
-
83
-
84
-
85
-
86
-
87
-
88
-
89
-
90
-
91
-
92
-
93
-
94
-
95
-
96
-
97
-
 98
98 -
 99
99 -
 100
100 -
 101
101 -
 102
102 -
 103
103 -
 104
104 -
 105
105 -
 106
106 -
 107
107 -
 108
108 -
 109
109 -
 110
110 -
 111
111 -
 112
112 -
 113
113 -
 114
114 -
 115
115 -
 116
116 -
 117
117 -
 118
118 -
119
-
120
-
121
-
122
-
123
-
124
 |
 |
Toyota Global Vision President’s Message Launching a New Structure Special Feature Review of Operations
Consolidated Performance
Highlights
Management and
Corporate Information Investor InformationFinancial Section
Page 108
NextPrev
ContentsSearchPrint
ANNUAL REPORT 2013
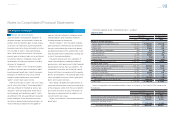
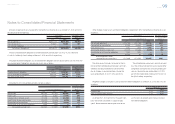
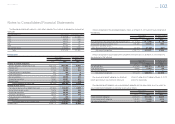
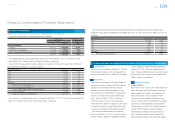
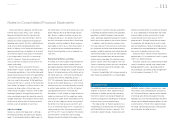
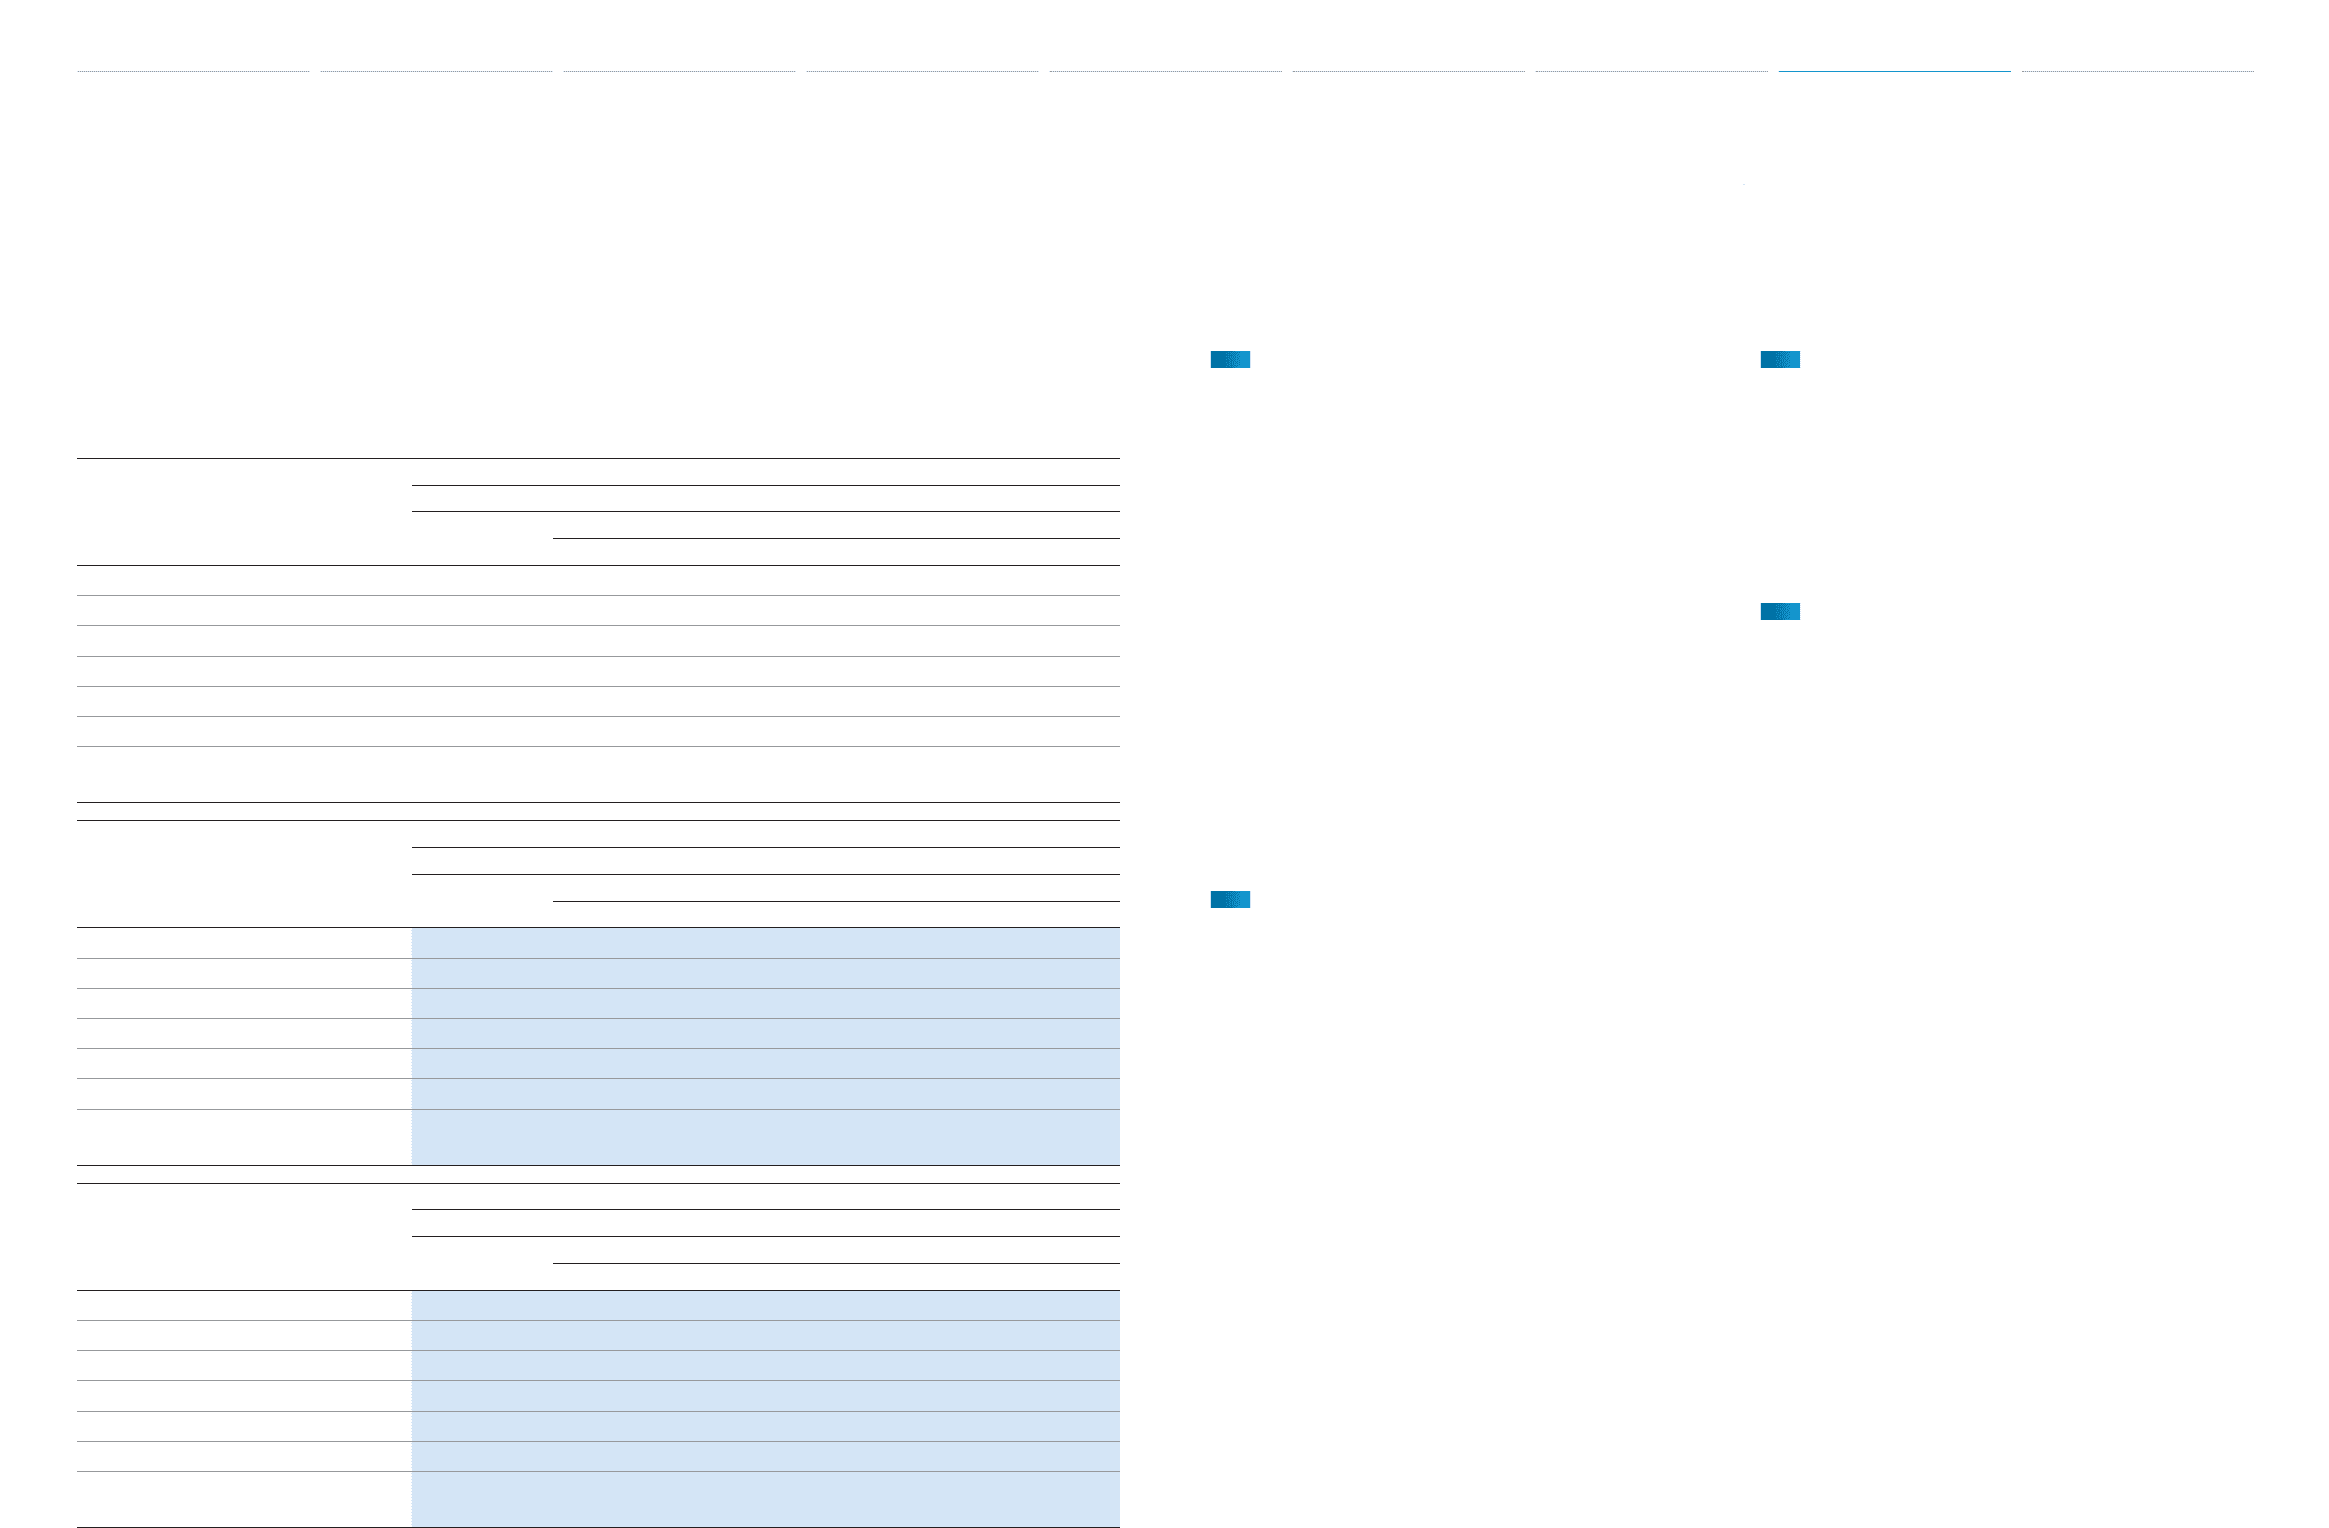
The following table summarizes the estimated fair values of Toyota’s fi nancial instruments, excluding market-
able securities and other securities investments, affi liated companies and derivative fi nancial instruments. See
note 26 to the consolidated fi nancial statements for three levels of input which are used to measure fair value.
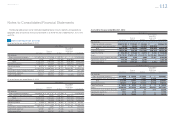
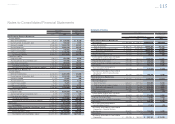
Yen in millions
March 31, 2012
Carrying
amount
Estimated fair value
Level 1 Level 2 Level 3 Total
Assets (Liabilities):
Cash and cash equivalents ¥1,679,200 ¥1,444,276 ¥ 234,924 ¥ — ¥ 1,679,200
Time deposits 80,301 — 80,301 — 80,301
Total fi nance receivables, net 8,879,731 — — 9,137,936 9,137,936
Other receivables 408,547 — — 408,547 408,547
Short-term borrowings (3,450,649) — (3,256,078) (194,571) (3,450,649)
Long-term debt including
the current portion (8,533,549) — (7,835,970) (847,223) (8,683,193)
Yen in millions
March 31, 2013
Carrying
amount
Estimated fair value
Level 1 Level 2 Level 3 Total
Assets (Liabilities):
Cash and cash equivalents ¥ 1,718,297 ¥1,342,356 ¥ 375,941 ¥ — ¥ 1,718,297
Time deposits 106,700 — 106,700 — 106,700
Total fi nance receivables, net 11,144,427 — — 11,434,936 11,434,936
Other receivables 432,693 — — 432,693 432,693
Short-term borrowings (4,089,528) — (4,089,528) — (4,089,528)
Long-term debt including
the current portion (10,020,853) — (9,244,942) (979,196) (10,224,138)
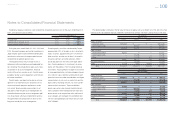
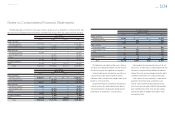
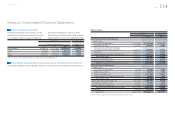
U.S. dollars in millions
March 31, 2013
Carrying
amount
Estimated fair value
Level 1 Level 2 Level 3 Total
Assets (Liabilities):
Cash and cash equivalents $ 18,270 $14,273 $ 3,997 $ — $ 18,270
Time deposits 1,135 — 1,135 — 1,135
Total fi nance receivables, net 118,495 — — 121,584 121,584
Other receivables 4,601 — — 4,601 4,601
Short-term borrowings (43,482) — (43,482) — (43,482)
Long-term debt including
the current portion (106,548) — (98,298) (10,412) (108,710)
Cash and cash equivalents and
time deposits
In the normal course of business, substantially all
cash and cash equivalents and time deposits are
highly liquid and are carried at amounts which
approximate fair value due to its short duration.
Cash equivalents and time deposits include nego-
tiable certifi cate of deposit measured at fair value on
a recurring basis. Where money market funds pro-
duce a daily net asset value in an active market, this
value is used to determine the fair value of the fund
investment, and the investment is classifi ed in Level
1. All other types of cash and cash equivalents and
time deposits are classifi ed in Level 2.
Finance receivables, net
The fair values of fi nance receivables are estimated
by discounting expected cash fl ows to present
value using internal assumptions, including prepay-
ment speeds, expected credit losses and collateral
value. Certain impaired fi nance receivables are mea-
sured at fair value on a nonrecurring basis based on
collateral values.
As unobservable inputs are utilized, fi nance
receivables are classifi ed in Level 3.
Other receivables
Other receivables are short-term receivables. These
receivables are carried at amounts which approxi-
mate fair value, and the difference between the car-
rying amount and the fair value is not material.
These receivables are classifi ed in Level 3.
Short-term borrowings and long-term debt
The fair values of short-term borrowings and long-
term debt including the current portion, except for
secured loans provided by securitization transac-
tions using special-purpose entities, are estimated
based on the discounted amounts of future cash
fl ows using Toyota’s current borrowing rates for sim-
ilar liabilities. As these inputs are observable, these
debts are classifi ed in Level 2.
The fair values of the secured loans provided by
securitization transactions are estimated based on
current market rates and credit spreads for debt
with similar maturities. Internal assumptions includ-
ing prepayment speeds and expected credit losses
are used to estimate the timing of cash fl ows to be
paid on the underlying securitized assets. As these
valuations utilize unobservable inputs, the secured
loans are classifi ed in Level 3. See note 12 to the
consolidated fi nancial statements for information
regarding the secured loans.
Notes to Consolidated Financial Statements
Selected Financial Summary (U.S. GAAP) Consolidated Segment Information Consolidated Quarterly Financial Summary Management’s Discussion and Analysis of Financial Condition and Results of Operations Consolidated Financial Statements Notes to Consolidated Financial Statements [31 of 44]
Management’s Annual Report on Internal Control over Financial Reporting Report of Independent Registered Public Accounting Firm