Toyota 2013 Annual Report Download - page 115
Download and view the complete annual report
Please find page 115 of the 2013 Toyota annual report below. You can navigate through the pages in the report by either clicking on the pages listed below, or by using the keyword search tool below to find specific information within the annual report.-
 1
1 -
2
-
3
-
4
-
5
-
6
-
7
-
8
-
9
-
10
-
11
-
12
-
13
-
14
-
15
-
16
-
17
-
18
-
19
-
20
-
21
-
22
-
23
-
24
-
25
-
26
-
27
-
28
-
29
-
30
-
31
-
32
-
33
-
34
-
35
-
36
-
37
-
38
-
39
-
40
-
41
-
42
-
43
-
44
-
45
-
46
-
47
-
48
-
49
-
50
-
51
-
52
-
53
-
54
-
55
-
56
-
57
-
58
-
59
-
60
-
61
-
62
-
63
-
64
-
65
-
66
-
67
-
68
-
69
-
70
-
71
-
72
-
73
-
74
-
75
-
76
-
77
-
78
-
79
-
80
-
81
-
82
-
83
-
84
-
85
-
86
-
87
-
88
-
89
-
90
-
91
-
92
-
93
-
94
-
95
-
96
-
97
-
98
-
99
-
100
-
101
-
102
-
103
-
104
-
 105
105 -
 106
106 -
 107
107 -
 108
108 -
 109
109 -
 110
110 -
 111
111 -
 112
112 -
 113
113 -
 114
114 -
 115
115 -
 116
116 -
 117
117 -
 118
118 -
 119
119 -
 120
120 -
 121
121 -
 122
122 -
 123
123 -
 124
124
 |
 |

Toyota Global Vision President’s Message Launching a New Structure Special Feature Review of Operations
Consolidated Performance
Highlights
Management and
Corporate Information Investor InformationFinancial Section
Page 115
NextPrev
ContentsSearchPrint
ANNUAL REPORT 2013
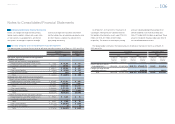
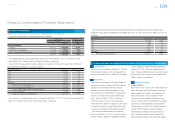
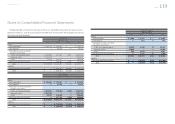
Yen in millions U.S. dollars in millions
March 31, March 31,
2012 2013 2013
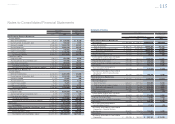
Non-Financial Services Businesses
Current liabilities
Short-term borrowings ¥ 715,019 ¥ 576,685 $ 6,132
Current portion of long-term debt 339,441 185,582 1,973
Accounts payable 2,234,316 2,092,722 22,251
Accrued expenses 1,737,490 2,092,102 22,245
Income taxes payable 123,344 140,935 1,499
Other current liabilities 1,175,801 1,186,870 12,619
Total current liabilities 6,325,411 6,274,896 66,719
Long-term liabilities
Long-term debt 503,070 521,428 5,544
Accrued pension and severance costs 700,211 754,360 8,021
Other long-term liabilities 531,982 969,668 10,310
Total long-term liabilities 1,735,263 2,245,456 23,875
Total Non-Financial Services Businesses liabilities 8,060,674 8,520,352 90,594
Financial Services Businesses
Current liabilities
Short-term borrowings 3,040,373 3,861,699 41,060
Current portion of long-term debt 2,218,526 2,538,249 26,988
Accounts payable 27,095 37,655 400
Accrued expenses 96,247 105,901 1,126
Income taxes payable 10,434 15,331 163
Other current liabilities 536,291 632,025 6,720
Total current liabilities 5,928,966 7,190,860 76,457
Long-term liabilities
Long-term debt 5,555,112 6,876,849 73,119
Accrued pension and severance costs 8,191 11,752 125
Other long-term liabilities 520,252 724,337 7,702
Total long-term liabilities 6,083,555 7,612,938 80,946
Total Financial Services Businesses liabilities 12,012,521 14,803,798 157,403
Eliminations (488,708) (613,689) (6,525)
Total liabilities 19,584,487 22,710,461 241,472
Total Toyota Motor Corporation shareholders’ equity 10,550,261 12,148,035 129,166
Noncontrolling interests 516,217 624,821 6,643
Total shareholders’ equity 11,066,478 12,772,856 135,809
Total liabilities and shareholders’ equity ¥30,650,965 ¥35,483,317 $377,281
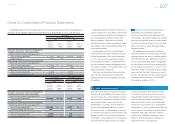
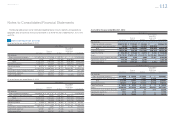
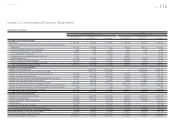
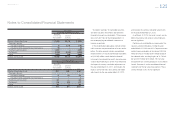
Statements of income
Yen in millions U.S. dollars in millions
For the years ended March 31,
For the year
ended March 31,
2011 2012 2013 2013
Non-Financial Services Businesses
Net revenues ¥17,826,986 ¥17,534,872 ¥20,943,634 $222,686
Costs and expenses
Cost of revenues 15,986,741 15,796,635 18,034,256 191,752
Selling, general and administrative 1,723,071 1,676,999 1,899,997 20,202
Total costs and expenses 17,709,812 17,473,634 19,934,253 211,954
Operating income 117,174 61,238 1,009,381 10,732
Other income (expense), net 88,840 69,935 79,837 849
Income before income taxes and equity
in earnings of affi liated companies 206,014 131,173 1,089,218 11,581
Provision for income taxes 178,795 141,558 436,223 4,638
Equity in earnings of affi liated companies 214,229 196,544 230,078 2,446
Net income 241,448 186,159 883,073 9,389
Less: Net income attributable to
noncontrolling interests (54,055) (82,181) (119,359) (1,269)
Net income attributable to Toyota Motor
Corporation—Non-Financial Services
Businesses 187,393 103,978 763,714 8,120
Financial Services Businesses
Net revenues 1,192,205 1,100,324 1,170,670 12,447
Costs and expenses
Cost of revenues 636,374 615,563 633,306 6,734
Selling, general and administrative 197,551 178,323 221,544 2,355
Total costs and expenses 833,925 793,886 854,850 9,089
Operating income 358,280 306,438 315,820 3,358
Other income (expense), net 1,349 (4,679) (970) (10)
Income before income taxes and equity
in earnings of affi liated companies 359,629 301,759 314,850 3,348
Provision for income taxes 134,094 120,725 116,033 1,234
Equity in earnings of affi liated companies 787 1,157 1,441 15
Net income 226,322 182,191 200,258 2,129
Less: Net income attributable to
noncontrolling interests (3,251) (2,566) (1,961) (21)
Net income attributable to Toyota Motor
Corporation—Financial Services
Businesses 223,071 179,625 198,297 2,108
Eliminations (2,281) (44) 152 2
Net income attributable to Toyota Motor
Corporation ¥ 408,183 ¥ 283,559 ¥ 962,163 $ 10,230
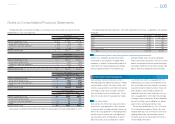
Notes to Consolidated Financial Statements
Selected Financial Summary (U.S. GAAP) Consolidated Segment Information Consolidated Quarterly Financial Summary Management’s Discussion and Analysis of Financial Condition and Results of Operations Consolidated Financial Statements Notes to Consolidated Financial Statements [38 of 44]
Management’s Annual Report on Internal Control over Financial Reporting Report of Independent Registered Public Accounting Firm