Toyota 2013 Annual Report Download - page 86
Download and view the complete annual report
Please find page 86 of the 2013 Toyota annual report below. You can navigate through the pages in the report by either clicking on the pages listed below, or by using the keyword search tool below to find specific information within the annual report.-
 1
1 -
2
-
3
-
4
-
5
-
6
-
7
-
8
-
9
-
10
-
11
-
12
-
13
-
14
-
15
-
16
-
17
-
18
-
19
-
20
-
21
-
22
-
23
-
24
-
25
-
26
-
27
-
28
-
29
-
30
-
31
-
32
-
33
-
34
-
35
-
36
-
37
-
38
-
39
-
40
-
41
-
42
-
43
-
44
-
45
-
46
-
47
-
48
-
49
-
50
-
51
-
52
-
53
-
54
-
55
-
56
-
57
-
58
-
59
-
60
-
61
-
62
-
63
-
64
-
65
-
66
-
67
-
68
-
69
-
70
-
71
-
72
-
73
-
74
-
75
-
 76
76 -
 77
77 -
 78
78 -
 79
79 -
 80
80 -
 81
81 -
 82
82 -
 83
83 -
 84
84 -
 85
85 -
 86
86 -
 87
87 -
 88
88 -
 89
89 -
 90
90 -
 91
91 -
 92
92 -
 93
93 -
 94
94 -
 95
95 -
 96
96 -
97
-
98
-
99
-
100
-
101
-
102
-
103
-
104
-
105
-
106
-
107
-
108
-
109
-
110
-
111
-
112
-
113
-
114
-
115
-
116
-
117
-
118
-
119
-
120
-
121
-
122
-
123
-
124
 |
 |

Toyota Global Vision President’s Message Launching a New Structure Special Feature Review of Operations
Consolidated Performance
Highlights
Management and
Corporate Information Investor InformationFinancial Section
Page 86
NextPrev
ContentsSearchPrint
ANNUAL REPORT 2013
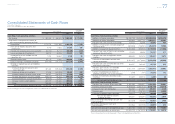
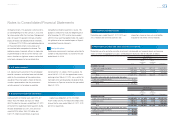
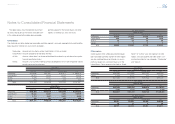
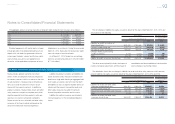
The tables below show the recorded investment
for each credit quality of the fi nance receivable with-
in the wholesale and other dealer loan receivables
portfolio segment in the United States and other
regions as of March 31, 2012 and 2013:
United States
The wholesale and other dealer loan receivables portfolio segment is primarily segregated into credit qualities
below based on internal risk assessments by dealers.
Performing:
Account not classifi ed as either Credit Watch, At Risk or Default
Credit Watch: Account designated for elevated attention
At Risk: Account where there is an increased likelihood that default may exist based on qualita-
tive and quantitative factors
Default: Account is not currently meeting contractual obligations or we have temporarily waived
certain contractual requirements
Yen in millions
March 31, 2012
Wholesale Real estate Working capital Total
Performing ¥513,632 ¥307,867 ¥116,871 ¥ 938,370
Credit Watch 55,513 38,382 5,014 98,909
At Risk 6,394 12,157 618 19,169
Default 466 30 423 919
Total ¥576,005 ¥358,436 ¥122,926 ¥1,057,367
Yen in millions
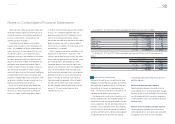
March 31, 2013
Wholesale Real estate Working capital Total
Performing ¥720,308 ¥373,176 ¥152,048 ¥1,245,532
Credit Watch 93,643 54,801 7,485 155,929
At Risk 3,114 2,651 2,641 8,406
Default 106 131 193 430
Total ¥817,171 ¥430,759 ¥162,367 ¥1,410,297
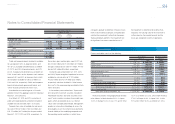
U.S. dollars in millions
March 31, 2013
Wholesale Real estate Working capital Total
Performing $7,659 $3,968 $1,616 $13,243
Credit Watch 996 583 80 1,659
At Risk 33 28 28 89
Default 112 4
Total $8,689 $4,580 $1,726 $14,995
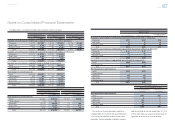
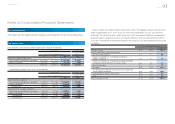
Other regions
Credit qualities of the wholesale and other dealer
loan receivables portfolio segment in other regions
are also monitored based on internal risk assess-
ments by dealers on a consistent basis as in the
United States. These accounts classifi ed as “Credit
Watch” or “At Risk” were not signifi cant in other
regions, and consequently the tables below sum-
marize information for two categories, “Performing”
and “Default”.
Yen in millions
March 31, 2012
Wholesale Real estate Working capital Total
Performing ¥330,264 ¥170,886 ¥451,505 ¥952,655
Default 17,429 6,072 431 23,932
Total ¥347,693 ¥176,958 ¥451,936 ¥976,587
Yen in millions
March 31, 2013
Wholesale Real estate Working capital Total
Performing ¥485,464 ¥225,808 ¥488,679 ¥1,199,951
Default 3,363 1,610 507 5,480
Total ¥488,827 ¥227,418 ¥489,186 ¥1,205,431
U.S. dollars in millions
March 31, 2013
Wholesale Real estate Working capital Total
Performing $5,161 $2,401 $5,196 $12,758
Default 36 17 6 59
Total $5,197 $2,418 $5,202 $12,817
Notes to Consolidated Financial Statements
Selected Financial Summary (U.S. GAAP) Consolidated Segment Information Consolidated Quarterly Financial Summary Management’s Discussion and Analysis of Financial Condition and Results of Operations Consolidated Financial Statements Notes to Consolidated Financial Statements [9 of 44]
Management’s Annual Report on Internal Control over Financial Reporting Report of Independent Registered Public Accounting Firm