Toyota 2013 Annual Report Download - page 105
Download and view the complete annual report
Please find page 105 of the 2013 Toyota annual report below. You can navigate through the pages in the report by either clicking on the pages listed below, or by using the keyword search tool below to find specific information within the annual report.-
 1
1 -
2
-
3
-
4
-
5
-
6
-
7
-
8
-
9
-
10
-
11
-
12
-
13
-
14
-
15
-
16
-
17
-
18
-
19
-
20
-
21
-
22
-
23
-
24
-
25
-
26
-
27
-
28
-
29
-
30
-
31
-
32
-
33
-
34
-
35
-
36
-
37
-
38
-
39
-
40
-
41
-
42
-
43
-
44
-
45
-
46
-
47
-
48
-
49
-
50
-
51
-
52
-
53
-
54
-
55
-
56
-
57
-
58
-
59
-
60
-
61
-
62
-
63
-
64
-
65
-
66
-
67
-
68
-
69
-
70
-
71
-
72
-
73
-
74
-
75
-
76
-
77
-
78
-
79
-
80
-
81
-
82
-
83
-
84
-
85
-
86
-
87
-
88
-
89
-
90
-
91
-
92
-
93
-
94
-
 95
95 -
 96
96 -
 97
97 -
 98
98 -
 99
99 -
 100
100 -
 101
101 -
 102
102 -
 103
103 -
 104
104 -
 105
105 -
 106
106 -
 107
107 -
 108
108 -
 109
109 -
 110
110 -
 111
111 -
 112
112 -
 113
113 -
 114
114 -
 115
115 -
116
-
117
-
118
-
119
-
120
-
121
-
122
-
123
-
124
 |
 |
Toyota Global Vision President’s Message Launching a New Structure Special Feature Review of Operations
Consolidated Performance
Highlights
Management and
Corporate Information Investor InformationFinancial Section
Page 105
NextPrev
ContentsSearchPrint
ANNUAL REPORT 2013
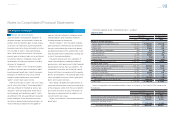
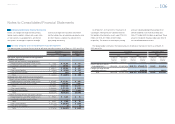
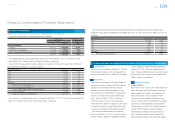
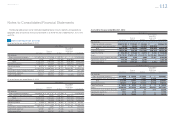
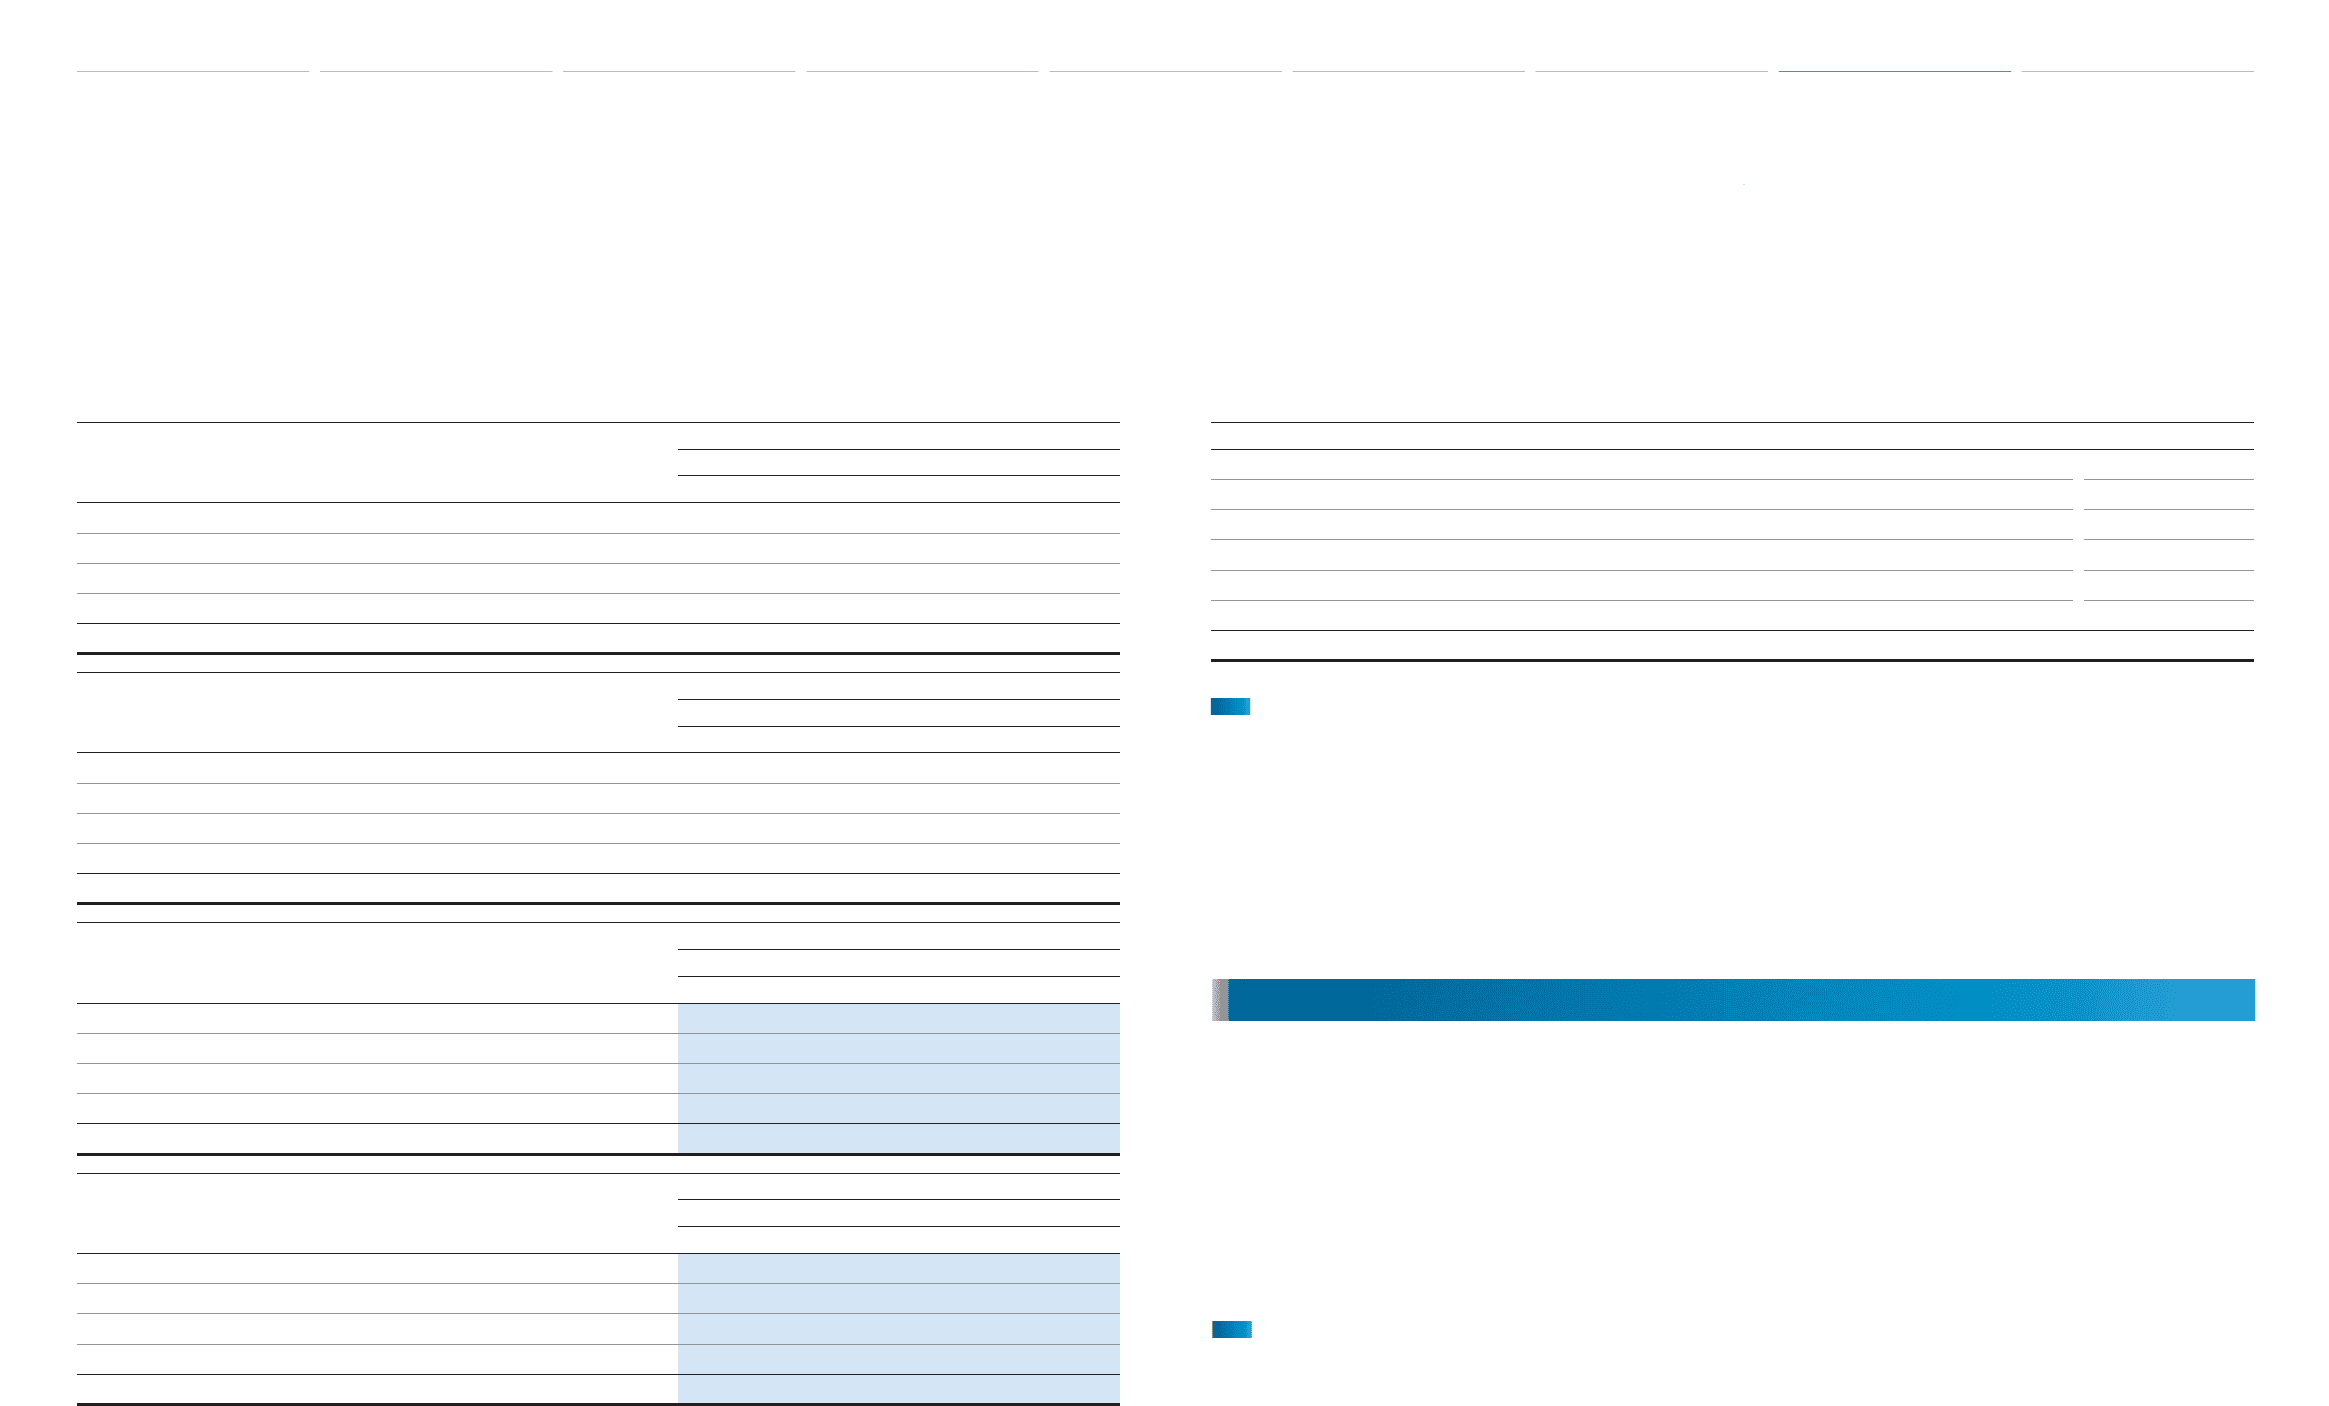
The following tables summarize the changes in Level 3 plan assets measured at fair value for the years
ended March 31, 2011, 2012 and 2013:
Yen in millions
For the year ended March 31, 2011
Debt securities Other Total
Balance at beginning of year ¥2,663 ¥ 9,097 ¥11,760
Actual return on plan assets 305 974 1,279
Purchases, sales and settlements (2,759) 11,471 8,712
Other (209) (1,065) (1,274)
Balance at end of year ¥ — ¥20,477 ¥20,477
Yen in millions
For the year ended March 31, 2012
Debt securities Other Total
Balance at beginning of year ¥— ¥20,477 ¥20,477
Actual return on plan assets — 1,243 1,243
Purchases, sales and settlements — 9,514 9,514
Other — 143 143
Balance at end of year ¥— ¥31,377 ¥31,377
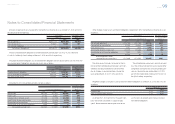
Yen in millions
For the year ended March 31, 2013
Debt securities Other Total
Balance at beginning of year ¥— ¥31,377 ¥31,377
Actual return on plan assets — 2,472 2,472
Purchases, sales and settlements — 2,599 2,599
Other — 4,159 4,159
Balance at end of year ¥— ¥40,607 ¥40,607
U.S. dollars in millions
For the year ended March 31, 2013
Debt securities Other Total
Balance at beginning of year $— $334 $334
Actual return on plan assets —2626
Purchases, sales and settlements —2828
Other —4444
Balance at end of year $— $432 $432
Toyota expects to contribute ¥8,688 million ($92 million) to its pension plans in the year ending March 31, 2014.
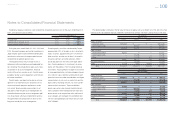
The following pension benefi t payments, which refl ect expected future service, as appropriate, are expected
to be paid:
Years ending March 31, Yen in millions U.S. dollars in millions
2014 ¥ 8,535 $ 91
2015 9,264 99
2016 9,955 106
2017 10,660 113
2018 11,491 122
from 2019 to 2023 73,651 783
Total ¥123,556 $1,314
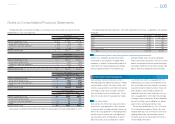
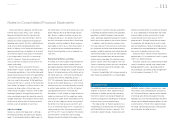
Postretirement benefi ts other than pensions and postemployment benefi ts
Toyota’s U.S. subsidiaries provide certain health
care and life insurance benefi
ts to eligible retired
employees. In addition, Toyota provides benefi ts to
certain former or inactive employees after employ-
ment, but before retirement. These benefi ts are
provided through various insurance companies,
health care providers and others. The costs of these
benefi ts are recognized over the period the employ-
ee provides credited service to Toyota. Toyota’s obli-
gations under these arrangements are not material.
Toyota employs derivative fi nancial instruments,
including foreign exchange forward contracts, foreign
currency options, interest rate swaps, interest rate
currency swap agreements and interest rate options
to manage its exposure to fl uctuations in interest
rates and foreign currency exchange rates. Toyota
does not use derivatives for speculation or trading.
Fair value hedges
Toyota enters into interest rate swaps and interest
rate currency swap agreements mainly to convert
its fi xed-rate debt to variable-rate debt. Toyota uses
interest rate swap agreements in managing interest
rate risk exposure. Interest rate swap agreements
are executed as either an integral part of specifi c
debt transactions or on a portfolio basis. Toyota
uses interest rate currency swap agreements to
hedge exposure to currency exchange rate fl uctua-
tions on principal and interest payments for borrow-
ings denominated in foreign currencies. Notes and
loans payable issued in foreign currencies are
hedged by concurrently executing interest rate cur-
rency swap agreements, which involve the exchange
of foreign currency principal and interest obligations
for each functional currency obligations at agreed-
upon currency exchange and interest rates.
For the years ended March 31, 2011, 2012 and
2013, the ineffective portion of Toyota’s fair value
hedge relationships was not material. For fair value
hedging relationships, the components of each
derivative’s gain or loss are included in the assess-
ment of hedge effectiveness.
20. Derivative fi nancial instruments
Notes to Consolidated Financial Statements
Selected Financial Summary (U.S. GAAP) Consolidated Segment Information Consolidated Quarterly Financial Summary Management’s Discussion and Analysis of Financial Condition and Results of Operations Consolidated Financial Statements Notes to Consolidated Financial Statements [28 of 44]
Management’s Annual Report on Internal Control over Financial Reporting Report of Independent Registered Public Accounting Firm