Toyota 2013 Annual Report Download - page 53
Download and view the complete annual report
Please find page 53 of the 2013 Toyota annual report below. You can navigate through the pages in the report by either clicking on the pages listed below, or by using the keyword search tool below to find specific information within the annual report.-
 1
1 -
2
-
3
-
4
-
5
-
6
-
7
-
8
-
9
-
10
-
11
-
12
-
13
-
14
-
15
-
16
-
17
-
18
-
19
-
20
-
21
-
22
-
23
-
24
-
25
-
26
-
27
-
28
-
29
-
30
-
31
-
32
-
33
-
34
-
35
-
36
-
37
-
38
-
39
-
40
-
41
-
42
-
 43
43 -
 44
44 -
 45
45 -
 46
46 -
 47
47 -
 48
48 -
 49
49 -
 50
50 -
 51
51 -
 52
52 -
 53
53 -
 54
54 -
 55
55 -
 56
56 -
 57
57 -
 58
58 -
 59
59 -
 60
60 -
 61
61 -
 62
62 -
 63
63 -
64
-
65
-
66
-
67
-
68
-
69
-
70
-
71
-
72
-
73
-
74
-
75
-
76
-
77
-
78
-
79
-
80
-
81
-
82
-
83
-
84
-
85
-
86
-
87
-
88
-
89
-
90
-
91
-
92
-
93
-
94
-
95
-
96
-
97
-
98
-
99
-
100
-
101
-
102
-
103
-
104
-
105
-
106
-
107
-
108
-
109
-
110
-
111
-
112
-
113
-
114
-
115
-
116
-
117
-
118
-
119
-
120
-
121
-
122
-
123
-
124
 |
 |

Toyota Global Vision President’s Message Launching a New Structure Special Feature Review of Operations
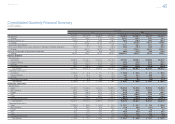
Consolidated Performance
Highlights
Management and
Corporate Information Investor InformationFinancial Section
Page 53
NextPrev
ContentsSearchPrint
ANNUAL REPORT 2013
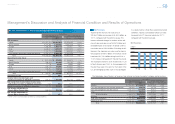
Operating costs and expenses increased by
¥2,515.2 billion, or 13.8%, to ¥20,743.3 billion dur-
ing fi scal 2013 compared with the prior fi scal year.
This increase resulted from the ¥2,360.0 billion
impact of changes in vehicle unit sales and sales
mix, the ¥270.0 billion unfavorable impact of fl uctu-
ations in foreign currency translation rates and the
¥335.2 billion increase in miscellaneous costs and
others, partially offset by the ¥450.0 billion impact
of cost reduction efforts.
The increase in miscellaneous costs and others
was due mainly to the ¥90.0 billion charge for costs
related to the settlement of the economic loss
claims in the consolidated federal action in the U.S.,
the ¥70.0 billion increase in labor costs, the ¥50.0
billion impact of increase in product quality related
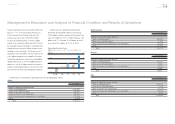
expenses and the ¥20.0 billion increase in research
and development expenses. This increase in prod-
uct quality related expenses resulted from the
weakening of the Japanese yen at the end of fi scal
2013 against other currencies in comparison to the
prior fi scal year. See note 14 to the consolidated
fi nancial statements.
During fi scal 2013, Toyota announced recalls and
other safety measures including the following:
In October 2012, Toyota announced in Japan
and other regions the voluntary safety recall of cer-
tain models of Toyota brands’ vehicles in relation to
the inspection and application of special fl uorine
grease to the driver’s side Power Window Master
Switch (PWMS). In November 2012, Toyota
Cost of Financing Operations
Cost of fi nancing operations increased by ¥37.7 bil-
lion, or 6.4%, to ¥630.4 billion during fi
scal 2013
compared with the prior fi scal year. The increase
resulted from the ¥33.1 billion unfavorable impact of
fl uctuations in foreign currency translation rates.
announced in Japan and other regions the voluntary
safety recall of certain models of Toyota brands’
vehicles in relation to the insuffi cient hardness treat-
ment of some intermediate extension shafts and in
relation to the electric water pump for the hybrid
system.
Cost Reduction Efforts
During fi scal 2013, Toyota’s continued cost reduc-
tion efforts reduced operating costs and expenses
by ¥450.0 billion. The amount of effect of cost
reduction efforts includes the impact of fl uctuation
in the price of steel, precious metals, non-ferrous
alloys including aluminum, plastic parts and other
production materials and parts. In fi scal 2013, con-
tinued cost reduction efforts together with suppliers
contributed to the improvement in earnings. These
cost reduction efforts related to ongoing value engi-
neering and value analysis activities, the use of
common parts resulting in a reduction of part types
and other manufacturing initiatives designed to
reduce the costs of vehicle production.
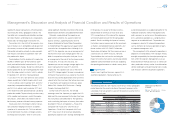
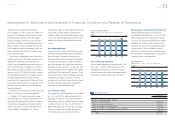
Cost of Products Sold
Cost of products sold increased by ¥2,214.6 billion,
or 14.0%, to ¥18,010.5 billion during fi
scal 2013
compared with the prior fi scal year. The increase
resulted from the ¥2,124.0 billion impact of changes
in vehicle unit sales and sales mix and the ¥201.0
billion unfavorable impact of fl uctuations in foreign
currency translation rates, partially offset by the
¥450.0 billion impact of cost reduction efforts.
Selling, General and Administrative Expenses
Selling, general and administrative expenses
increased by ¥262.8 billion, or 14.3%, to ¥2,102.3
billion during fi
scal 2013 compared with the prior
fi scal year. This increase refl ected the ¥90.0 billion
charge for costs related to the settlement of the
economic loss claims in the consolidated federal
action in the U.S., the ¥43.2 billion increase in
expenses for the fi nancial services operations and
the ¥35.8 billion unfavorable impact of fl uctuations
in foreign currency translation rates.
20,000
0
100
15,000 75
10,000 50
5,000 25
0
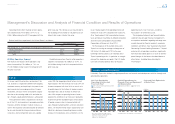
Cost of Products Sold
왎왎 Cost of products sold 쎲쎲 % of net revenues (Right scale)
(¥ Billion)
FY
(%)
’09 ’10 ’11 ’12 ’13
1,000
0
5
800 4
600 3
2
200
400
1
0
R&D Expenses
왎왎 R&D expenses 쎲쎲 % of net revenues (Right scale)
(¥ Billion)
FY
(%)
’09 ’10 ’11 ’12 ’13
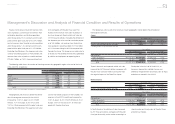
Operating Income
Yen in millions
2013 vs. 2012 Change
Changes in operating income and loss:
Effect of marketing efforts ¥650,000
Effect of cost reduction efforts 450,000
Effect of changes in exchange rates 150,000
Effect of increase of miscellaneous costs and others (300,000)
Other 15,261
Total ¥965,261
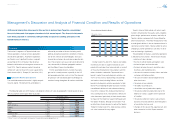
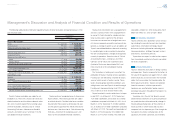
Management’s Discussion and Analysis of Financial Condition and Results of Operations
Selected Financial Summary (U.S. GAAP) Consolidated Segment Information Consolidated Quarterly Financial Summary Management’s Discussion and Analysis of Financial Condition and Results of Operations [8 of 26] Consolidated Financial Statements Notes to Consolidated Financial Statements
Management’s Annual Report on Internal Control over Financial Reporting Report of Independent Registered Public Accounting Firm