Toyota 2013 Annual Report Download - page 52
Download and view the complete annual report
Please find page 52 of the 2013 Toyota annual report below. You can navigate through the pages in the report by either clicking on the pages listed below, or by using the keyword search tool below to find specific information within the annual report.-
 1
1 -
2
-
3
-
4
-
5
-
6
-
7
-
8
-
9
-
10
-
11
-
12
-
13
-
14
-
15
-
16
-
17
-
18
-
19
-
20
-
21
-
22
-
23
-
24
-
25
-
26
-
27
-
28
-
29
-
30
-
31
-
32
-
33
-
34
-
35
-
36
-
37
-
38
-
39
-
40
-
41
-
 42
42 -
 43
43 -
 44
44 -
 45
45 -
 46
46 -
 47
47 -
 48
48 -
 49
49 -
 50
50 -
 51
51 -
 52
52 -
 53
53 -
 54
54 -
 55
55 -
 56
56 -
 57
57 -
 58
58 -
 59
59 -
 60
60 -
 61
61 -
 62
62 -
63
-
64
-
65
-
66
-
67
-
68
-
69
-
70
-
71
-
72
-
73
-
74
-
75
-
76
-
77
-
78
-
79
-
80
-
81
-
82
-
83
-
84
-
85
-
86
-
87
-
88
-
89
-
90
-
91
-
92
-
93
-
94
-
95
-
96
-
97
-
98
-
99
-
100
-
101
-
102
-
103
-
104
-
105
-
106
-
107
-
108
-
109
-
110
-
111
-
112
-
113
-
114
-
115
-
116
-
117
-
118
-
119
-
120
-
121
-
122
-
123
-
124
 |
 |
Toyota Global Vision President’s Message Launching a New Structure Special Feature Review of Operations
Consolidated Performance
Highlights
Management and
Corporate Information Investor InformationFinancial Section
Page 52
NextPrev
ContentsSearchPrint
ANNUAL REPORT 2013
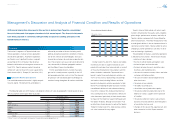
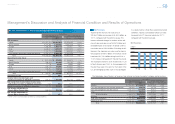
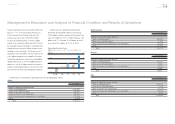
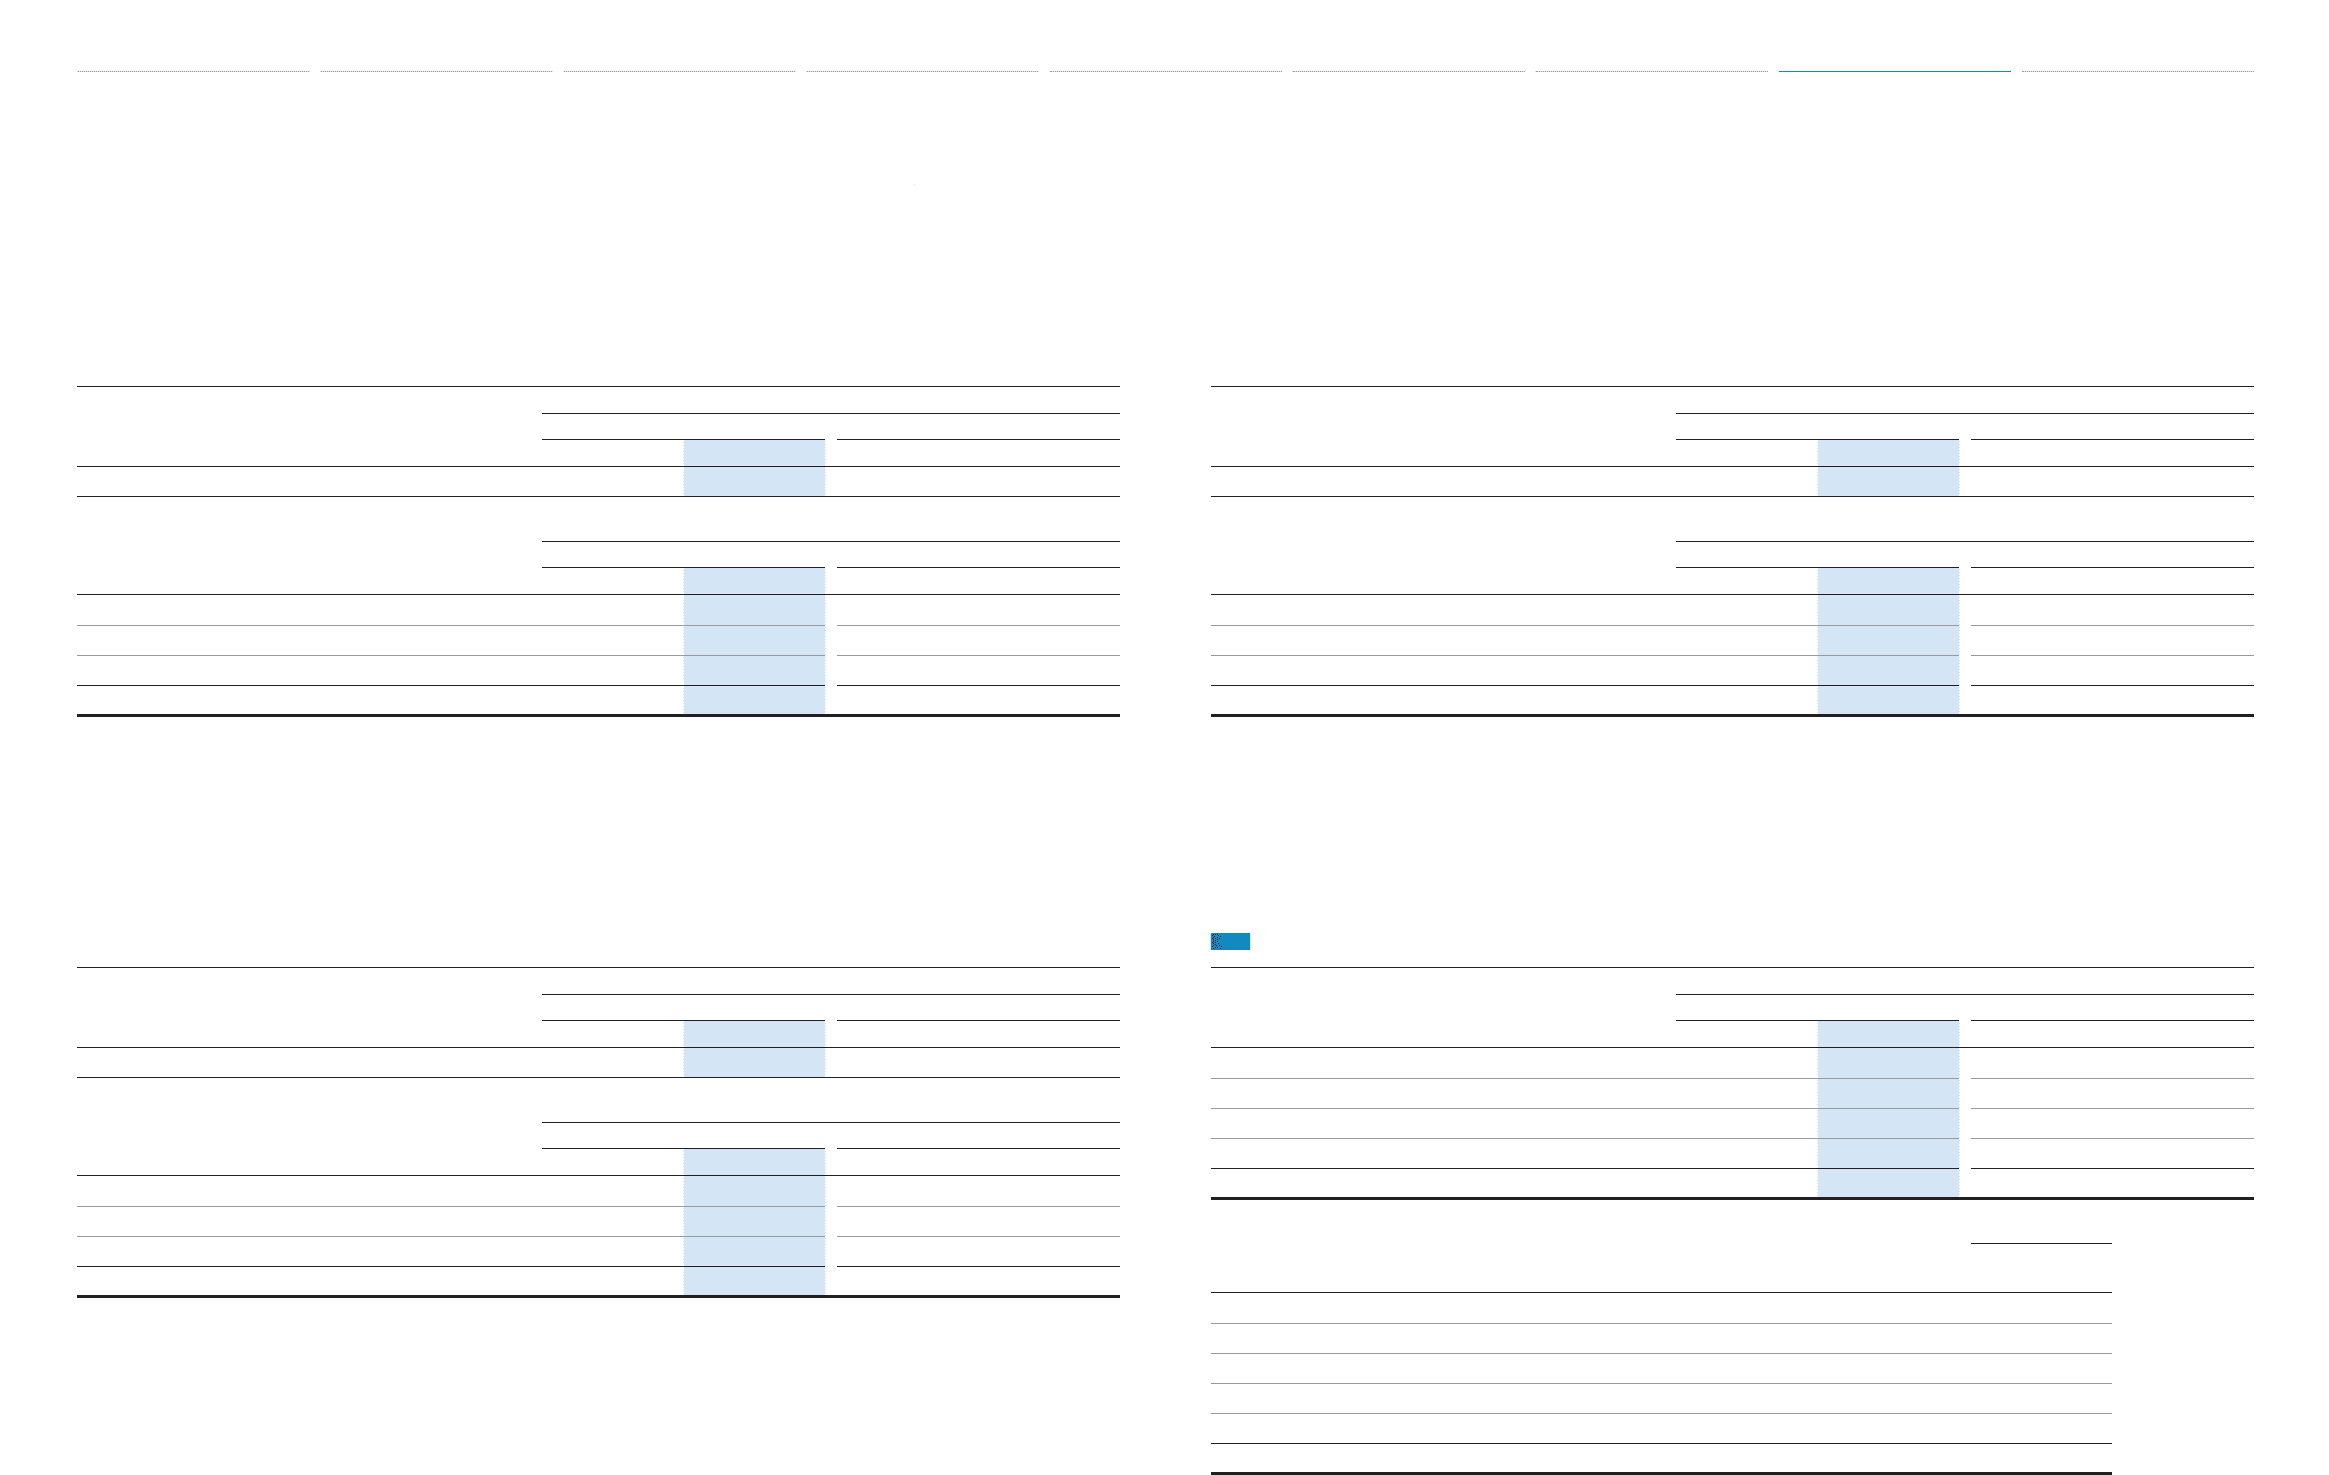
Europe
Thousands of units
Years ended March 31, 2013 vs. 2012 Change
2012 2013 Amount Percentage (%)
Toyota’s consolidated vehicle unit sales 798 799 1 +0.1
Yen in millions
Years ended March 31, 2013 vs. 2012 Change
2012 2013 Amount Percentage (%)
Net revenues:
Sales of products ¥1,925,670 ¥2,007,207 ¥81,537 +4.2
Financial services 68,276 75,906 7,630 +11.2
Total ¥1,993,946 ¥2,083,113 ¥89,167 +4.5
Net revenues in Europe as a whole increased due
primarily to the 1 thousand vehicles increase in
vehicle unit sales compared with the prior fi scal
year. The vehicle unit sales increased in Eastern
Europe, especially in Russia, although sales of
Toyota brands’ vehicles decreased in Western
Europe compared with the prior fi scal year due to
the European sovereign debt crisis.
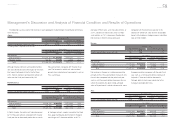
Asia
Thousands of units
Years ended March 31, 2013 vs. 2012 Change
2012 2013 Amount Percentage (%)
Toyota’s consolidated vehicle unit sales 1,327 1,684 357 +26.9
Yen in millions
Years ended March 31, 2013 vs. 2012 Change
2012 2013 Amount Percentage (%)
Net revenues:
Sales of products ¥3,275,871 ¥4,307,943 ¥1,032,072 +31.5
Financial services 58,403 77,533 19,130 +32.8
Total ¥3,334,274 ¥4,385,476 ¥1,051,202 +31.5
Net revenues in Asia as a whole increased due
primarily to the 357 thousand vehicles increase in
vehicle unit sales compared with the prior fi scal
year. The vehicle unit sales increased due mainly to
the expansion of markets such as Thailand and
Indonesia, and the recovery during fi scal 2013 from
the negative impacts of the fl ood in Thailand in
fi scal 2012.
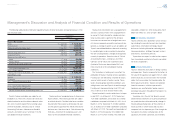
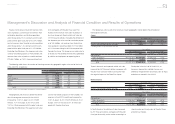
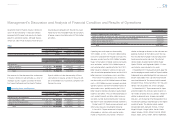
Other
Thousands of units
Years ended March 31, 2013 vs. 2012 Change
2012 2013 Amount Percentage (%)
Toyota’s consolidated vehicle unit sales 1,284 1,640 356 +27.8
Yen in millions
Years ended March 31, 2013 vs. 2012 Change
2012 2013 Amount Percentage (%)
Net revenues:
Sales of products ¥1,636,043 ¥1,942,215 ¥306,172 +18.7
Financial services 124,132 152,050 27,918 +22.5
Total ¥1,760,175 ¥2,094,265 ¥334,090 +19.0
Net revenues in Other as a whole increased due pri-
marily to the 356 thousand vehicles increase in
vehicle unit sales compared with the prior fi scal
year. The vehicle unit sales increased due mainly to
strong sales of IMV and Land Cruiser in each region
in fi scal 2013 and the recovery from the shortages
of parts supplies caused by the Great East Japan
Earthquake and the fl ood in Thailand in fi scal 2012.
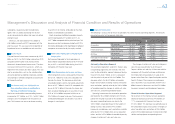
Operating Costs and Expenses
Yen in millions
Years ended March 31, 2013 vs. 2012 Change
2012 2013 Amount Percentage (%)
Operating costs and expenses:
Cost of products sold ¥15,795,918 ¥18,010,569 ¥2,214,651 +14.0
Cost of fi nancing operations 592,646 630,426 37,780 +6.4
Selling, general and administrative 1,839,462 2,102,309 262,847 +14.3
Total ¥18,228,026 ¥20,743,304 ¥2,515,278 +13.8
Yen in millions
2013 vs. 2012
Change
Changes in operating costs and expenses:
Effect of changes in vehicle unit sales and sales mix ¥2,360,000
Effect of fl uctuation in foreign currency translation rates 270,000
Effect of cost reduction efforts (450,000)
Effect of increase in miscellaneous costs and others 335,278
Total ¥2,515,278
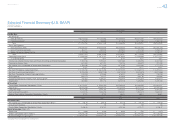
Management’s Discussion and Analysis of Financial Condition and Results of Operations
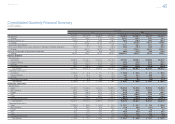
Selected Financial Summary (U.S. GAAP) Consolidated Segment Information Consolidated Quarterly Financial Summary Management’s Discussion and Analysis of Financial Condition and Results of Operations [7 of 26] Consolidated Financial Statements Notes to Consolidated Financial Statements
Management’s Annual Report on Internal Control over Financial Reporting Report of Independent Registered Public Accounting Firm