Toyota 2013 Annual Report Download - page 107
Download and view the complete annual report
Please find page 107 of the 2013 Toyota annual report below. You can navigate through the pages in the report by either clicking on the pages listed below, or by using the keyword search tool below to find specific information within the annual report.-
 1
1 -
2
-
3
-
4
-
5
-
6
-
7
-
8
-
9
-
10
-
11
-
12
-
13
-
14
-
15
-
16
-
17
-
18
-
19
-
20
-
21
-
22
-
23
-
24
-
25
-
26
-
27
-
28
-
29
-
30
-
31
-
32
-
33
-
34
-
35
-
36
-
37
-
38
-
39
-
40
-
41
-
42
-
43
-
44
-
45
-
46
-
47
-
48
-
49
-
50
-
51
-
52
-
53
-
54
-
55
-
56
-
57
-
58
-
59
-
60
-
61
-
62
-
63
-
64
-
65
-
66
-
67
-
68
-
69
-
70
-
71
-
72
-
73
-
74
-
75
-
76
-
77
-
78
-
79
-
80
-
81
-
82
-
83
-
84
-
85
-
86
-
87
-
88
-
89
-
90
-
91
-
92
-
93
-
94
-
95
-
96
-
 97
97 -
 98
98 -
 99
99 -
 100
100 -
 101
101 -
 102
102 -
 103
103 -
 104
104 -
 105
105 -
 106
106 -
 107
107 -
 108
108 -
 109
109 -
 110
110 -
 111
111 -
 112
112 -
 113
113 -
 114
114 -
 115
115 -
 116
116 -
 117
117 -
118
-
119
-
120
-
121
-
122
-
123
-
124
 |
 |

Toyota Global Vision President’s Message Launching a New Structure Special Feature Review of Operations
Consolidated Performance
Highlights
Management and
Corporate Information Investor InformationFinancial Section
Page 107
NextPrev
ContentsSearchPrint
ANNUAL REPORT 2013
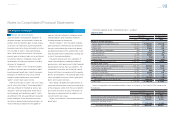
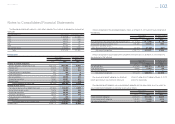
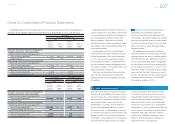
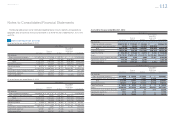
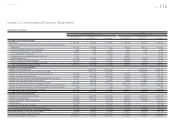
The following table summarizes the gains and losses on derivative fi nancial instruments and hedged items
reported in the consolidated statements of income for the years ended March 31, 2011, 2012 and 2013:
Yen in millions
For the years ended March 31,
2011 2012
Gains or
(losses) on
derivative
fi nancial
instruments
Gains or
(losses) on
hedged
items
Gains or
(losses) on
derivative
fi nancial
instruments
Gains or
(losses) on
hedged
items
Derivative fi nancial instruments designated as
hedging instruments—Fair value hedge:
Interest rate and currency swap agreements
Cost of fi nancing operations ¥ 71,491 ¥(68,741) ¥ (1,354) ¥2,999
Interest expense (166) 166 — —
Undesignated derivative fi nancial instruments:
Interest rate and currency swap agreements
Cost of fi nancing operations ¥ 72,082 ¥ — ¥35,834 ¥ —
Foreign exchange gain (loss), net (1,393) — (28) —
Foreign exchange forward and option contracts
Cost of fi nancing operations (2,693) — (3,815) —
Foreign exchange gain (loss), net 110,211 — 53,272 —
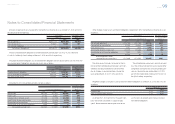
Yen in millions U.S. dollars in millions
For the year ended March 31, For the year ended March 31,
2013 2013
Gains or
(losses) on
derivative
fi nancial
instruments
Gains or
(losses) on
hedged
items
Gains or
(losses) on
derivative
fi nancial
instruments
Gains or
(losses) on
hedged
items
Derivative fi nancial instruments designated as
hedging instruments—Fair value hedge:
Interest rate and currency swap agreements
Cost of fi nancing operations ¥(23,965) ¥24,738 $(255) $263
Interest expense ————
Undesignated derivative fi nancial instruments:
Interest rate and currency swap agreements
Cost of fi nancing operations ¥(24,204) ¥ — $(257) $ —
Foreign exchange gain (loss), net 1,617 — 17 —
Foreign exchange forward and option contracts
Cost of fi nancing operations (4,572) — (49) —
Foreign exchange gain (loss), net (49,239) — (524) —
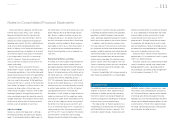
Undesignated derivative fi nancial instruments are
used to manage risks of fl uctuations in interest rates
to certain borrowing transactions and in foreign cur-
rency exchange rates of certain currency receiv-
ables and payables. Toyota accounts for these
derivative fi nancial instruments as economic hedges
with changes in the fair value recorded directly into
current period earnings.
Unrealized gains or (losses) on undesignated
derivative fi nancial instruments reported in the cost
of fi nancing operations for the years ended March
31, 2011, 2012 and 2013 were ¥93,370 million,
¥(14,934) million and ¥(60,727) million ($(646) mil-
lion) those reported in foreign exchange gain (loss),
net were ¥(240) million, ¥(5,543) million and ¥(7,447)
million ($(79) million), respectively.
Cash fl ows from transactions of derivative fi nan-
cial instruments are included in cash fl ows from
operating activities in the consolidated statements
of cash fl ows.
Credit risk related contingent features
Toyota enters into International Swaps and
Derivatives Association Master Agreements with
counterparties. These Master Agreements contain a
provision requiring either Toyota or the counterparty
to settle the contract or to post assets to the other
party in the event of a ratings downgrade below a
specifi ed threshold.
The aggregate fair value amount of derivative
fi nancial instruments that contain credit risk related
contingent features that are in a net liability position
after being offset by cash collateral as of March 31,
2013 is ¥3,289 million ($35 million). The aggregate
fair value amount of assets that are already posted
as cash collateral as of March 31, 2013 is ¥17,305
million ($184 million). If the ratings of Toyota decline
below specifi ed thresholds, the maximum amount
of assets to be posted or for which Toyota could be
required to settle the contracts is ¥3,289 million
($35 million) as of March 31, 2013.
Toyota has certain fi nancial instruments, including
fi nancial assets and liabilities which arose in the nor-
mal course of business. These fi nancial instruments
are executed with creditworthy fi nancial institutions,
and virtually all foreign currency contracts are
denominated in U.S. dollars, euros and other cur-
rencies of major developed countries. Financial
instruments involve, to varying degrees, market risk
as instruments are subject to price fl uctuations, and
elements of credit risk in the event a counterparty
should default. In the unlikely event the counterpar-
ties fail to meet the contractual terms of a foreign
currency or an interest rate instrument, Toyota’s
risk is limited to the fair value of the instrument.
Although Toyota may be exposed to losses in the
event of nonperformance by counterparties on
fi nancial instruments, it does not anticipate signifi -
cant losses due to the nature of its counterparties.
Counterparties to Toyota’s fi nancial instruments rep-
resent, in general, international fi nancial institutions.
Additionally, Toyota does not have a signifi cant
exposure to any individual counterparty. Toyota
believes that the overall credit risk related to its
fi nancial instruments is not signifi cant.
21. Other fi nancial instruments
Notes to Consolidated Financial Statements
Selected Financial Summary (U.S. GAAP) Consolidated Segment Information Consolidated Quarterly Financial Summary Management’s Discussion and Analysis of Financial Condition and Results of Operations Consolidated Financial Statements Notes to Consolidated Financial Statements [30 of 44]
Management’s Annual Report on Internal Control over Financial Reporting Report of Independent Registered Public Accounting Firm