Toyota 2013 Annual Report Download - page 61
Download and view the complete annual report
Please find page 61 of the 2013 Toyota annual report below. You can navigate through the pages in the report by either clicking on the pages listed below, or by using the keyword search tool below to find specific information within the annual report.-
 1
1 -
2
-
3
-
4
-
5
-
6
-
7
-
8
-
9
-
10
-
11
-
12
-
13
-
14
-
15
-
16
-
17
-
18
-
19
-
20
-
21
-
22
-
23
-
24
-
25
-
26
-
27
-
28
-
29
-
30
-
31
-
32
-
33
-
34
-
35
-
36
-
37
-
38
-
39
-
40
-
41
-
42
-
43
-
44
-
45
-
46
-
47
-
48
-
49
-
50
-
 51
51 -
 52
52 -
 53
53 -
 54
54 -
 55
55 -
 56
56 -
 57
57 -
 58
58 -
 59
59 -
 60
60 -
 61
61 -
 62
62 -
 63
63 -
 64
64 -
 65
65 -
 66
66 -
 67
67 -
 68
68 -
 69
69 -
 70
70 -
 71
71 -
72
-
73
-
74
-
75
-
76
-
77
-
78
-
79
-
80
-
81
-
82
-
83
-
84
-
85
-
86
-
87
-
88
-
89
-
90
-
91
-
92
-
93
-
94
-
95
-
96
-
97
-
98
-
99
-
100
-
101
-
102
-
103
-
104
-
105
-
106
-
107
-
108
-
109
-
110
-
111
-
112
-
113
-
114
-
115
-
116
-
117
-
118
-
119
-
120
-
121
-
122
-
123
-
124
 |
 |

Toyota Global Vision President’s Message Launching a New Structure Special Feature Review of Operations
Consolidated Performance
Highlights
Management and
Corporate Information Investor InformationFinancial Section
Page 61
NextPrev
ContentsSearchPrint
ANNUAL REPORT 2013
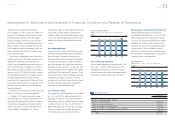
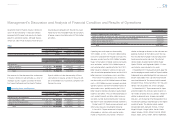
The decrease in operating losses in Japan refl ects
the ¥195.0 billion of favorable impact by changes in
vehicle unit sales and sales mix and other opera-
tional factors and ¥235.3 billion impact of the cost
reduction efforts, and decrease in miscellaneous
costs and others, partially offset by the ¥275.0 bil-
lion unfavorable impact of effect of fl uctuation in
foreign currency transaction rates and others. The
cost reduction efforts, decrease in miscellaneous costs
and others mainly refl ect the ¥130.0 billion impact of
the cost reduction efforts and ¥40.0 billion decrease in
miscellaneous costs and others. The increase in vehicle
unit sales was mainly due to introduction of new prod-
ucts such as Prius 움 and Aqua.
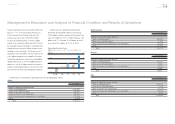
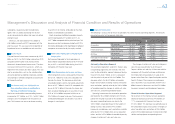
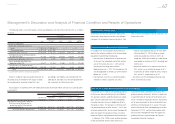
North America
Yen in millions
2012 vs. 2011 Change
Changes in operating income and loss:
Effect of changes in vehicle unit sales and sales mix and other operational factors ¥ (5,000)
Effect of fl uctuation in foreign currency translation rates and others (7,500)
Effect of cost reduction efforts, increase in miscellaneous costs and others (140,594)
Total ¥(153,094)
The decrease in operating income in North America
was due to the ¥55.0 billion decrease in operating
income in the fi nancial services operations, the
¥7.5 billion unfavorable impact of the fl uctuations in
foreign currency translation rates and others, the
¥5.0 billion negative impact of changes in vehicle unit
sales and sales mix and other operational factors
and the ¥90.0 billion increase in miscellaneous
costs and others.
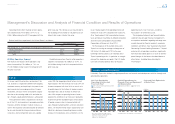
Europe
Yen in millions
2012 vs. 2011 Change
Changes in operating income and loss:
Effect of changes in vehicle unit sales and sales mix and other operational factors ¥(15,000)
Effect of fl uctuation in foreign currency translation rates and others (1,200)
Effect of cost reduction efforts, decrease in miscellaneous costs and others 20,848
Total ¥ 4,648
The increase in operating income in Europe was
due to the ¥10.0 billion impact of cost reduction
efforts and the ¥5.0 billion increase in operating
income in the fi nancial services operations, partially
offset by ¥15.0 billion negative impact of changes in
vehicle unit sales and sales mix and other opera-
tional factors and the ¥1.2 billion unfavorable impact
of fl uctuations in foreign currency translation rates
and others.
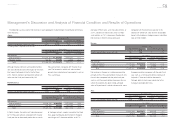
Asia
Yen in millions
2012 vs. 2011 Change
Changes in operating income and loss:
Effect of changes in vehicle unit sales and sales mix and other operational factors ¥(10,000)
Effect of fl uctuation in foreign currency translation rates and others 11,600
Effect of cost reduction efforts, increase in miscellaneous costs and others (57,787)
Total ¥(56,187)
The decrease in operating income in Asia was due
to the ¥10.0 billion negative impact of changes in
vehicle unit sales and sales mix and other opera-
tional factors and others and the ¥35.0 billion
increase in miscellaneous costs and others, partially
offset by the ¥11.6 billion favorable impact of the
fl uctuation in foreign currency translation rates
and others.
Other Income and Expenses
Interest and dividend income increased by ¥9.0 bil-
lion, or 10.0%, to ¥99.8 billion during fi scal 2012
compared with the prior fi scal year.
Interest expense decreased by ¥6.3 billion, or
21.8%, to ¥22.9 billion during fi scal 2012 compared
with the prior fi scal year.
Foreign exchange gain, net increased by ¥22.8
billion, or 159.4%, to ¥37.1 billion during fi scal 2012
compared with the prior fi scal year.
The net gain of ¥37.1 billion in fi scal 2012 was
primarily attributable to Toyota Motor Corporation’s
receivables denominated in the U.S. dollars, specifi -
cally transactional gains on account of an increase
in export volume due to the recovery of production
levels in the second half of fi scal 2012 after the
Great East Japan Earthquake, and the weakening
of the Japanese yen against the U.S. dollar in the
second half of fi scal 2012, together with the impact
of forward foreign currency exchange contracts,
which were mainly denominated in the U.S. dollars
and the yen as well as the euro and the yen.
The ¥22.8 billion increase in foreign exchange
gain, net, during fi scal 2012 compared with the
prior fi scal year was mainly attributable to the losses
incurred by certain subsidiaries during fi scal 2011.
Such losses were principally due to the Brazilian real
and the Thai baht, the functional currencies for
Toyota Motor Corporation’s Brazilian and Thai
Management’s Discussion and Analysis of Financial Condition and Results of Operations
Selected Financial Summary (U.S. GAAP) Consolidated Segment Information Consolidated Quarterly Financial Summary Management’s Discussion and Analysis of Financial Condition and Results of Operations [16 of 26] Consolidated Financial Statements Notes to Consolidated Financial Statements
Management’s Annual Report on Internal Control over Financial Reporting Report of Independent Registered Public Accounting Firm