Toyota 2013 Annual Report Download - page 26
Download and view the complete annual report
Please find page 26 of the 2013 Toyota annual report below. You can navigate through the pages in the report by either clicking on the pages listed below, or by using the keyword search tool below to find specific information within the annual report.-
 1
1 -
2
-
3
-
4
-
5
-
6
-
7
-
8
-
9
-
10
-
11
-
12
-
13
-
14
-
15
-
 16
16 -
 17
17 -
 18
18 -
 19
19 -
 20
20 -
 21
21 -
 22
22 -
 23
23 -
 24
24 -
 25
25 -
 26
26 -
 27
27 -
 28
28 -
 29
29 -
 30
30 -
 31
31 -
 32
32 -
 33
33 -
 34
34 -
 35
35 -
 36
36 -
37
-
38
-
39
-
40
-
41
-
42
-
43
-
44
-
45
-
46
-
47
-
48
-
49
-
50
-
51
-
52
-
53
-
54
-
55
-
56
-
57
-
58
-
59
-
60
-
61
-
62
-
63
-
64
-
65
-
66
-
67
-
68
-
69
-
70
-
71
-
72
-
73
-
74
-
75
-
76
-
77
-
78
-
79
-
80
-
81
-
82
-
83
-
84
-
85
-
86
-
87
-
88
-
89
-
90
-
91
-
92
-
93
-
94
-
95
-
96
-
97
-
98
-
99
-
100
-
101
-
102
-
103
-
104
-
105
-
106
-
107
-
108
-
109
-
110
-
111
-
112
-
113
-
114
-
115
-
116
-
117
-
118
-
119
-
120
-
121
-
122
-
123
-
124
 |
 |

[3 of 3]
Toyota Global Vision President’s Message Launching a New Structure Special Feature Review of Operations
Consolidated Performance
Highlights
Management and
Corporate Information Investor InformationFinancial Section
Page 26
NextPrev
ContentsSearchPrint
ANNUAL REPORT 2013
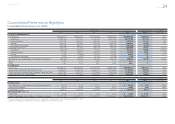
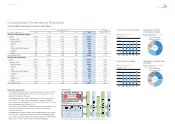
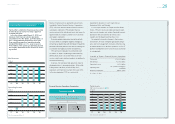
Consolidated Performance Highlights
Consolidated Vehicle Production and Sales
Thousands of units % change
Fiscal years ended March 31 2009 2010 2011 2012 2013 2013 vs. 2012
Vehicle Production by Region:
Japan 4,255 3,956 3,721 3,940 4,276 +8.5
Overseas Total 2,796 2,853 3,448 3,495 4,422 +26.5
North America 919 1,042 1,338 1,275 1,677 +31.5
Europe 482 433 372 383 368 -3.9
Asia 947 1,021 1,344 1,441 1,924 +33.5
Central and South America 151 146 148 152 205 +34.9
Oceania 130 106 113 93 100 +7.5
Africa 167 105 133 151 148 -2.0
Consolidated Total 7,051 6,809 7,169 7,435 8,698 +17.0
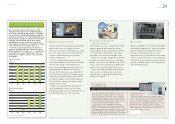
Vehicle Sales by Region:
Japan 1,945 2,163 1,913 2,071 2,279 +10.0
Overseas Total 5,622 5,074 5,395 5,281 6,592 +24.8
North America 2,212 2,098 2,031 1,872 2,469 +31.9
Europe 1,062 858 796 798 799 +0.1
Asia 905 979 1,255 1,327 1,684 +26.9
Central and South America 279 231 281 289 364 +26.0
Oceania 261 251 248 223 271 +21.5
Africa 289 184 209 214 259 +21.0
Middle East 606 466 569 550 741 +34.7
Other 8 7 6 8 5-37.5
Consolidated Total 7,567 7,237 7,308 7,352 8,871 +20.7
10,000
0
6,000
2,000
4,000
8,000
10,000
0
6,000
2,000
4,000
8,000
왎 Japan 왎 Overseas Total 왎 Japan 왎 North America 왎 Europe
왎 Asia 왎 Other Regions
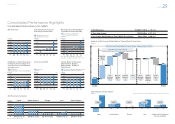
Vehicle Production by Region
(Thousands of units)
FY ’09 ’10 ’11 ’12 ’13
Breakdown of Vehicle
Production by Region
Consolidated Total:
8,698 thousand units
49.2%
19.3%
FY2013
4.2%
22.1%
5.2%
왎 Japan 왎 Overseas Total 왎 Japan 왎 North America 왎 Europe
왎 Asia 왎 Other Regions
Vehicle Sales by Region
(Thousands of units)
FY ’09 ’10 ’11 ’12 ’13
Breakdown of Vehicle Sales
by Region
Consolidated Total:
8,871 thousand units
25.7%
27.8%
FY2013
9.0%
19.0%
18.5%
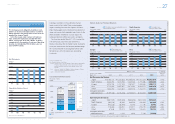
[Reference] Vehicle Sales
> Consolidated vehicle unit sales in Japan and overseas came to 8,871,000
in the fi scal year ended March 31, 2013, up 1,519,000, or 20.7%, com-
pared with the previous fi scal year.
> Consolidated vehicle unit sales in Japan were 2,279,000, an increase of
208,000, or 10.1%, year on year. Excluding mini-vehicles, Toyota and
Lexus vehicle unit sales (retail) was 1,612,000, up 162,000, or 11.2%, rep-
resenting a record market share of 48.4%.
> Total vehicle unit sales (retail), including the Daihatsu and Hino brands, was
also a historic high, reaching 9,692,000, a year-on-year increase of
1,358,000, or 16.3%.
> Consolidated Lexus vehicle unit sales came to approximately 500,000, around
85,000, or 20.6%, higher than the previous fi scal year. By geographic region,
Lexus vehicle unit sales in Japan, North America, Europe, Asia, and other were
about 42,000, 270,000, 43,000, 92,000, and 49,000, respectively. * There are certain exceptional cases that do not follow the aforementioned fl ow.
Vehicle Sales