Toyota 2013 Annual Report Download - page 59
Download and view the complete annual report
Please find page 59 of the 2013 Toyota annual report below. You can navigate through the pages in the report by either clicking on the pages listed below, or by using the keyword search tool below to find specific information within the annual report.-
 1
1 -
2
-
3
-
4
-
5
-
6
-
7
-
8
-
9
-
10
-
11
-
12
-
13
-
14
-
15
-
16
-
17
-
18
-
19
-
20
-
21
-
22
-
23
-
24
-
25
-
26
-
27
-
28
-
29
-
30
-
31
-
32
-
33
-
34
-
35
-
36
-
37
-
38
-
39
-
40
-
41
-
42
-
43
-
44
-
45
-
46
-
47
-
48
-
 49
49 -
 50
50 -
 51
51 -
 52
52 -
 53
53 -
 54
54 -
 55
55 -
 56
56 -
 57
57 -
 58
58 -
 59
59 -
 60
60 -
 61
61 -
 62
62 -
 63
63 -
 64
64 -
 65
65 -
 66
66 -
 67
67 -
 68
68 -
 69
69 -
70
-
71
-
72
-
73
-
74
-
75
-
76
-
77
-
78
-
79
-
80
-
81
-
82
-
83
-
84
-
85
-
86
-
87
-
88
-
89
-
90
-
91
-
92
-
93
-
94
-
95
-
96
-
97
-
98
-
99
-
100
-
101
-
102
-
103
-
104
-
105
-
106
-
107
-
108
-
109
-
110
-
111
-
112
-
113
-
114
-
115
-
116
-
117
-
118
-
119
-
120
-
121
-
122
-
123
-
124
 |
 |
Toyota Global Vision President’s Message Launching a New Structure Special Feature Review of Operations
Consolidated Performance
Highlights
Management and
Corporate Information Investor InformationFinancial Section
Page 59
NextPrev
ContentsSearchPrint
ANNUAL REPORT 2013
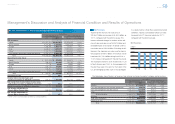
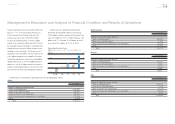
Despite the fl ood in Thailand, Toyota’s vehicle unit
sales in Asia increased by 72 thousand vehicles
compared with the prior fi scal year due to steady
growth in automotive markets. Although Toyota’s
vehicle unit sales in Asia increased, net revenues in
Asia decreased compared with the prior fi scal year
mainly due to the unfavorable impact of fl uctuations
in foreign currency translation rates of ¥168.8 billion
and others.
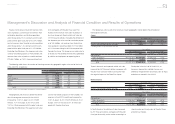
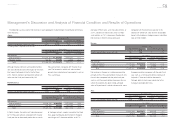
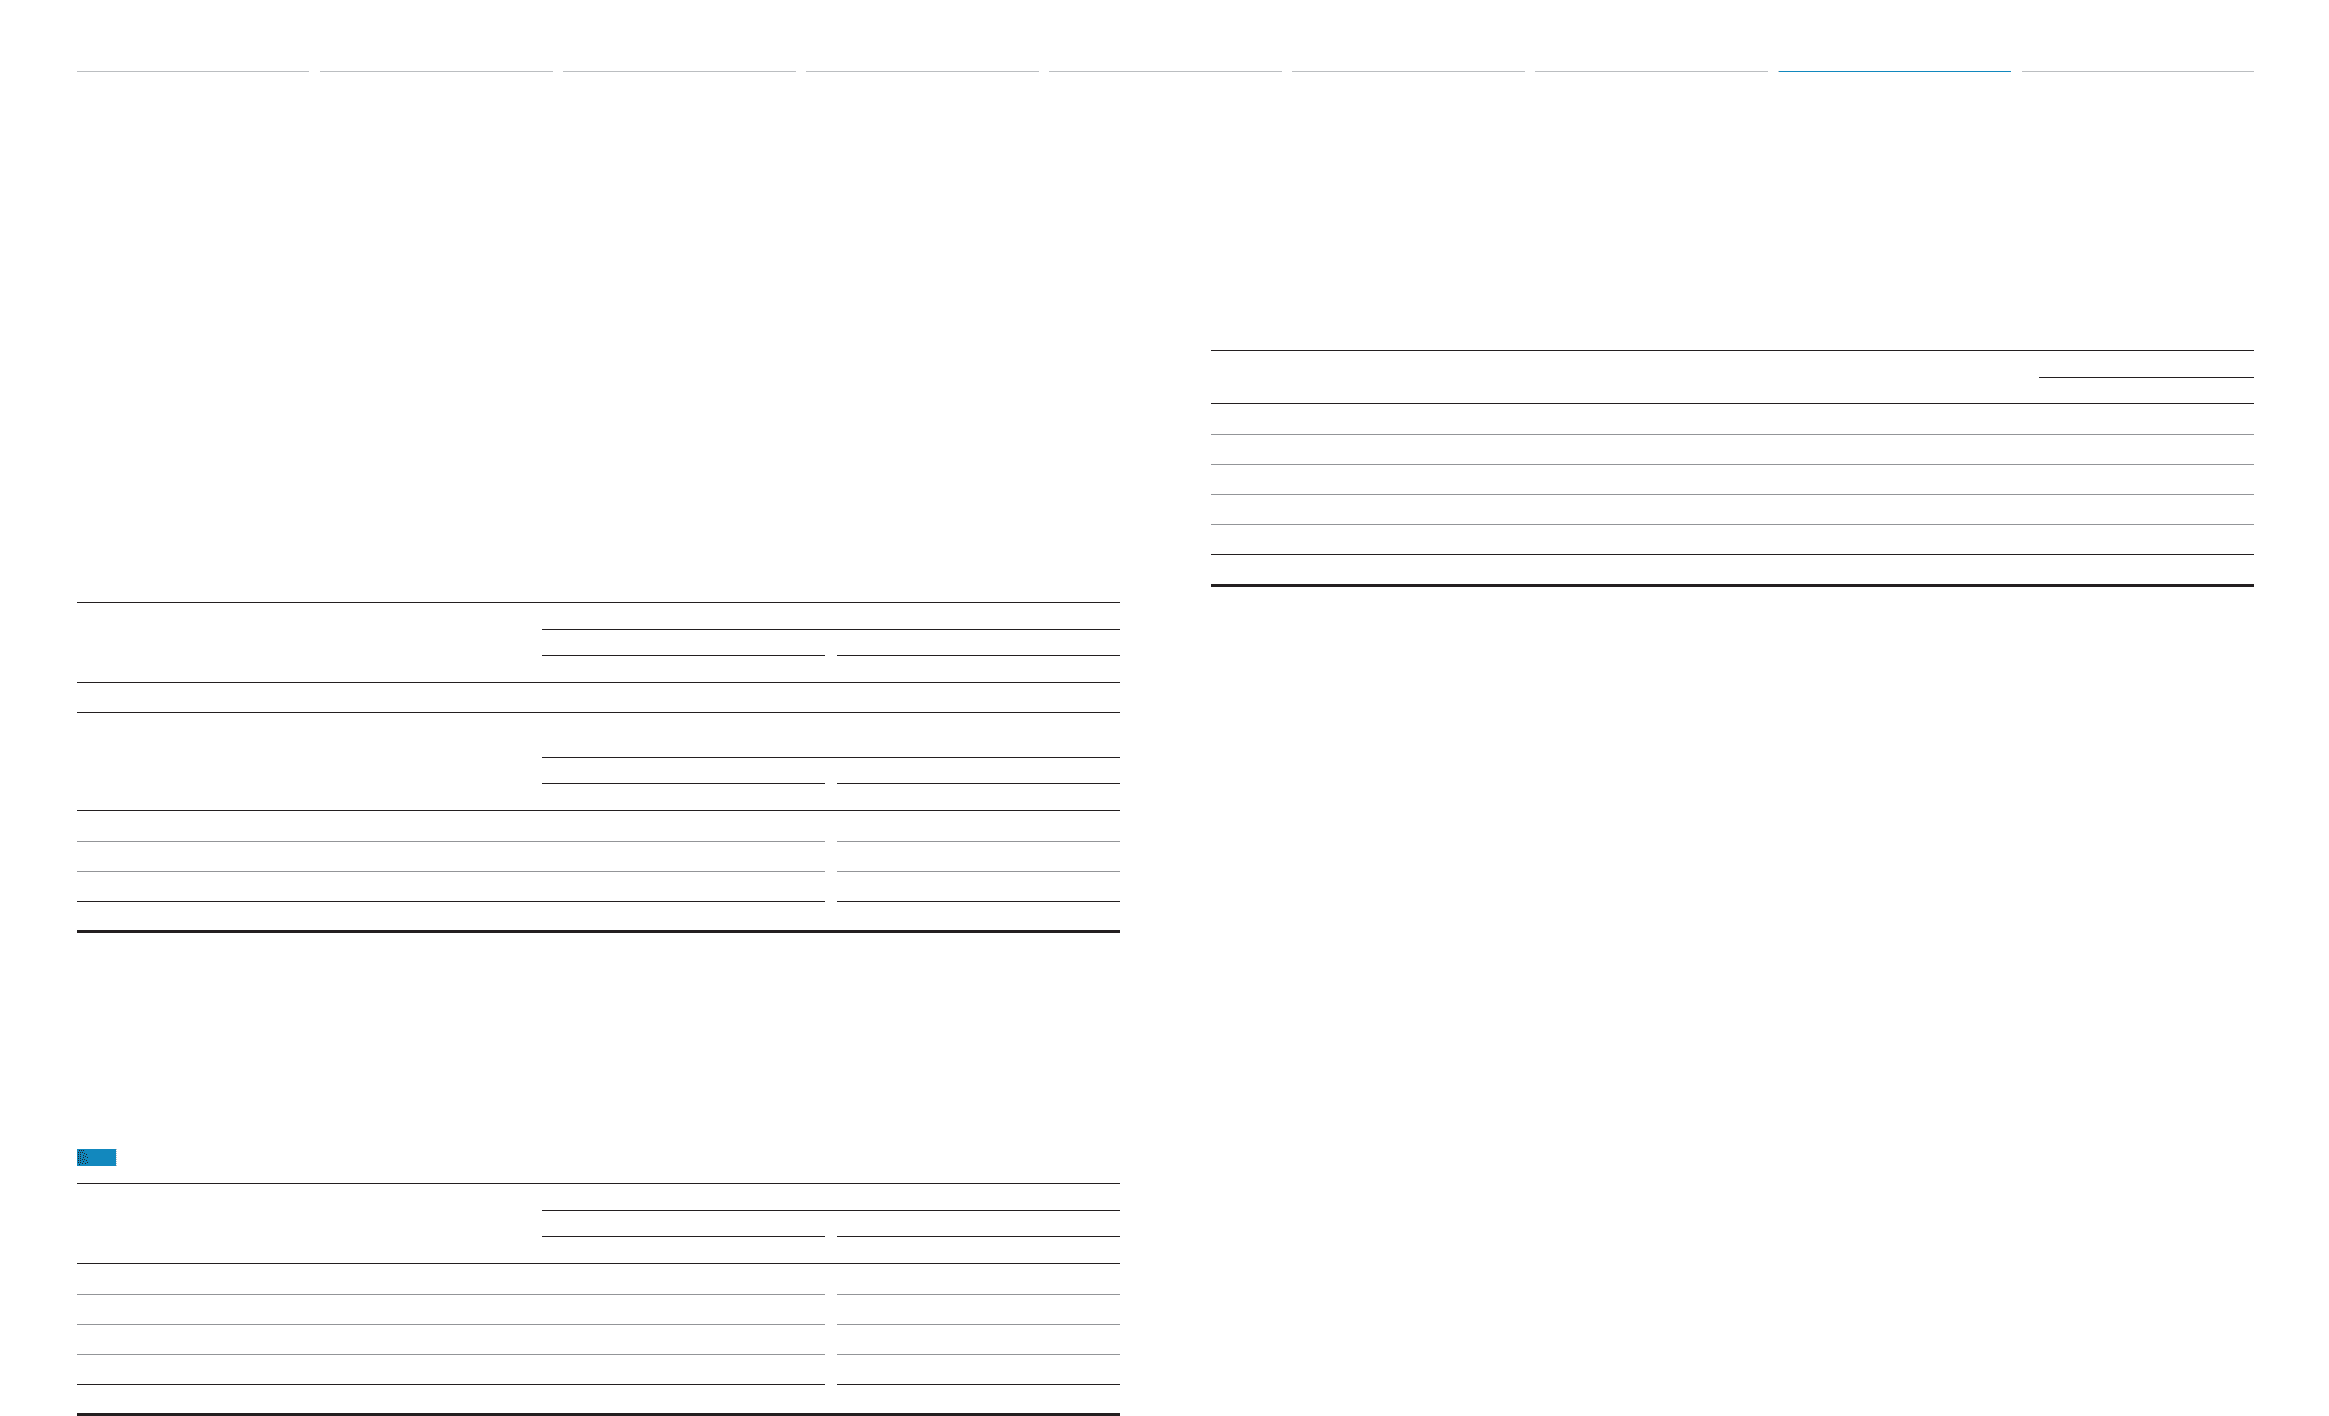
Other
Thousands of units
Years ended March 31, 2012 vs. 2011 Change
2011 2012 Amount Percentage (%)
Toyota’s consolidated vehicle unit sales 1,313 1,284 (29) –2.2
Yen in millions
Years ended March 31, 2012 vs. 2011 Change
2011 2012 Amount Percentage (%)
Net revenues:
Sales of products ¥1,694,680 ¥1,636,043 ¥(58,637) –3.5
Financial services 114,436 124,132 9,696 +8.5
Total ¥1,809,116 ¥1,760,175 ¥(48,941) –2.7
Net revenues in Other decreased due to decreases
in Toyota’s vehicle unit sales primarily as a result of
shortages of parts supplies caused by the Great
East Japan Earthquake and the fl ood in Thailand.
Toyota’s vehicle unit sales decreased by 25 thou-
sand vehicles in Oceania, and by 19 thousand vehi-
cles in the Middle East, respectively, compared with
the prior fi scal year.
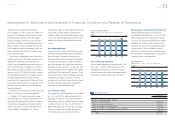
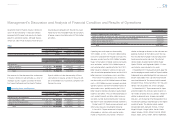
Operating Costs and Expenses
Yen in millions
Years ended March 31, 2012 vs. 2011 Change
2011 2012 Amount Percentage (%)
Operating costs and expenses:
Cost of products sold ¥15,985,783 ¥15,795,918 ¥(189,865) –1.2
Cost of fi nancing operations 629,543 592,646 (36,897) –5.9
Selling, general and administrative 1,910,083 1,839,462 (70,621) –3.7
Total ¥18,525,409 ¥18,228,026 ¥(297,383) –1.6
Yen in millions
2012 vs. 2011 Change
Changes in operating costs and expenses:
Effect of changes in vehicle unit sales and sales mix and other operational factors ¥ 150,000
Effect of fl uctuation in foreign currency translation rates and others (432,300)
Effect of cost reduction efforts (150,000)
Effect of increase in miscellaneous costs and others 134,917
Total ¥(297,383)
Operating costs and expenses decreased by
¥297.3 billion, or 1.6%, to ¥18,228.0 billion during
fi scal 2012 compared with the prior fi scal year. This
decrease resulted from the ¥432.3 billion favorable
impact of fl uctuations in foreign currency translation
rates and others, and the ¥150.0 billion impact of
cost reduction efforts, partially offset by the ¥150.0
billion impact of changes in vehicle unit sales and
sales mix and other operational factors and the ¥134.9
billion increase in miscellaneous costs and others.
The increase in miscellaneous costs and others
was due mainly to a ¥100.0 billion increase in labor
costs, a ¥50.0 billion increase in research and devel-
opment expenses and the ¥104.9 billion increase in
other various costs, partially offset by the ¥120.0
billion impact of decrease in product quality related
expenses and others. This cost decreased because
costs related to recalls and other safety measures
occurred at a high level during the prior fi scal year.
See note 14 to the consolidated fi nancial statements.
During fi scal 2012, Toyota announced recalls and
other safety measures including the following:
In June 2011, Toyota announced in Japan and
other regions a voluntary safety recall of certain
models of Toyota and Lexus brands’ vehicles in
relation to damage to elements of the substrate and
potential shutdown of the hybrid system that may
have resulted from improper manufacturing of elec-
tronic converter control substrate. The affected
vehicle models included Harrier Hybrid, Kluger
Hybrid, RX400h, and Highlander Hybrid, 111 thou-
sand vehicles were included in this recall.
In September 2011, Toyota announced in Japan the
service campaign of certain models of Toyota in relation
to abnormal noise and oil leakage that may have result-
ed from slack of bolts in the sub transmission and the
rear wheel differential. The affected vehicle models
included EstimaL, EstimaT and Wish, 181 thousand
vehicles were included in this service campaign.
In November 2011, Toyota announced in Japan
and other regions the voluntary safety recall of cer-
tain models of Toyota and Lexus brands’ vehicles in
relation to abnormal noise, charge warning light
indicators, and increasing of handle operation force
resulted from peeling of a bonded part of the engine
crankshaft pulley. The affected vehicle models
included AlphardG, AlphardV, EstimaL, EstimaT,
KlugerV, KlugerL, Kluger Hybrid, Harrier, Harrier
Hybrid, Windom, RX300, RX330, RX400h, ES300,
ES330, Solara, Camry, Avalon, Sienna, Highlander,
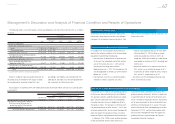
Management’s Discussion and Analysis of Financial Condition and Results of Operations
Selected Financial Summary (U.S. GAAP) Consolidated Segment Information Consolidated Quarterly Financial Summary Management’s Discussion and Analysis of Financial Condition and Results of Operations [14 of 26] Consolidated Financial Statements Notes to Consolidated Financial Statements
Management’s Annual Report on Internal Control over Financial Reporting Report of Independent Registered Public Accounting Firm