Toyota 2013 Annual Report Download - page 65
Download and view the complete annual report
Please find page 65 of the 2013 Toyota annual report below. You can navigate through the pages in the report by either clicking on the pages listed below, or by using the keyword search tool below to find specific information within the annual report.-
 1
1 -
2
-
3
-
4
-
5
-
6
-
7
-
8
-
9
-
10
-
11
-
12
-
13
-
14
-
15
-
16
-
17
-
18
-
19
-
20
-
21
-
22
-
23
-
24
-
25
-
26
-
27
-
28
-
29
-
30
-
31
-
32
-
33
-
34
-
35
-
36
-
37
-
38
-
39
-
40
-
41
-
42
-
43
-
44
-
45
-
46
-
47
-
48
-
49
-
50
-
51
-
52
-
53
-
54
-
 55
55 -
 56
56 -
 57
57 -
 58
58 -
 59
59 -
 60
60 -
 61
61 -
 62
62 -
 63
63 -
 64
64 -
 65
65 -
 66
66 -
 67
67 -
 68
68 -
 69
69 -
 70
70 -
 71
71 -
 72
72 -
 73
73 -
 74
74 -
 75
75 -
76
-
77
-
78
-
79
-
80
-
81
-
82
-
83
-
84
-
85
-
86
-
87
-
88
-
89
-
90
-
91
-
92
-
93
-
94
-
95
-
96
-
97
-
98
-
99
-
100
-
101
-
102
-
103
-
104
-
105
-
106
-
107
-
108
-
109
-
110
-
111
-
112
-
113
-
114
-
115
-
116
-
117
-
118
-
119
-
120
-
121
-
122
-
123
-
124
 |
 |
Toyota Global Vision President’s Message Launching a New Structure Special Feature Review of Operations
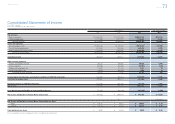
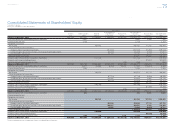
Consolidated Performance
Highlights
Management and
Corporate Information Investor InformationFinancial Section
Page 65
NextPrev
ContentsSearchPrint
ANNUAL REPORT 2013
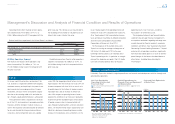
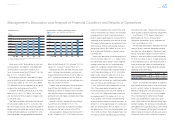
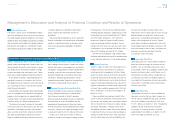
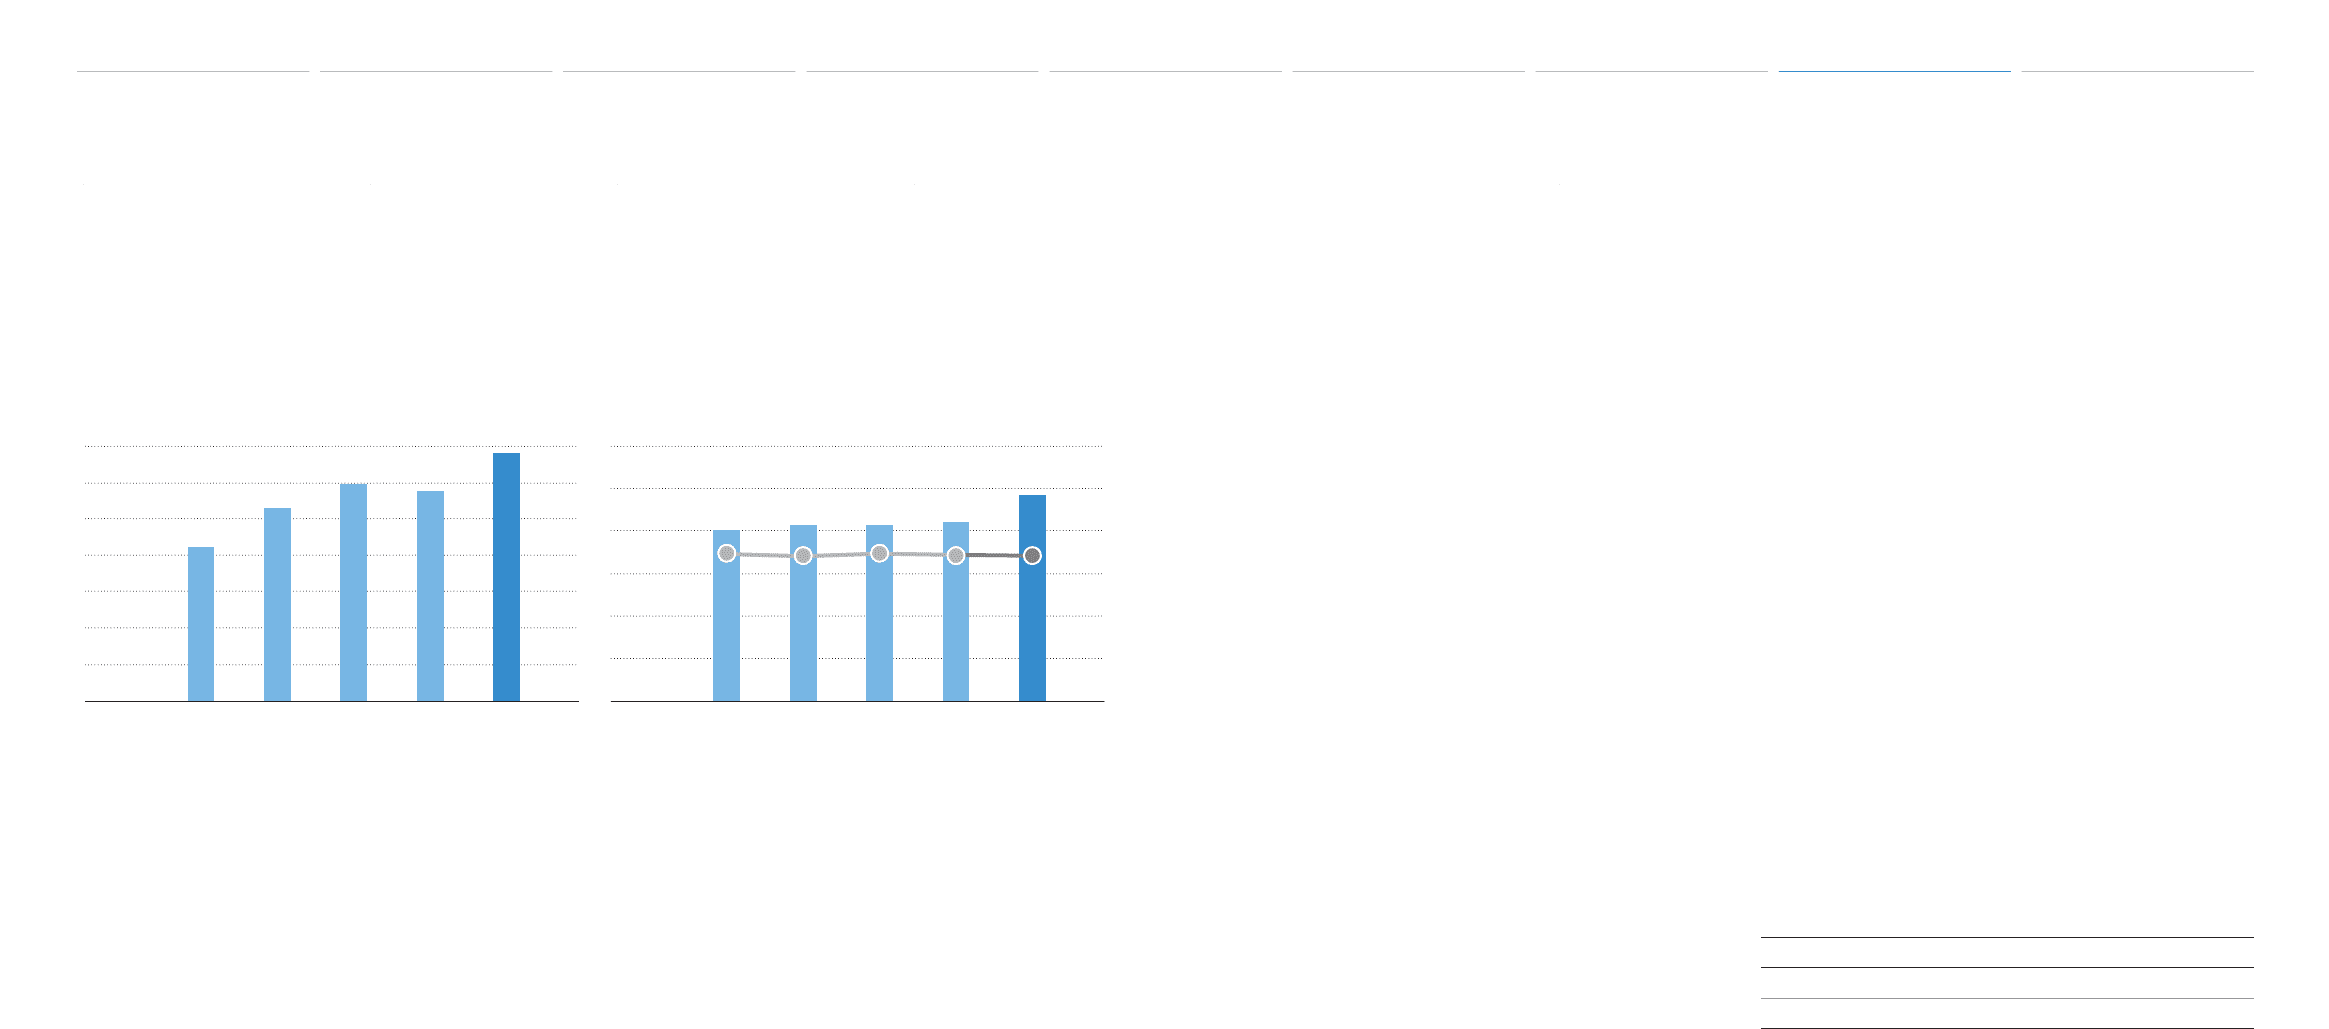
Liquid assets, which Toyota defi nes as cash and
cash equivalents, time deposits, marketable debt
securities and its investment in monetary trust
funds, increased during fi scal 2013 by ¥1,043.0 bil-
lion, or 18.1%, to ¥6,804.5 billion.
Trade accounts and notes receivable, less allow-
ance for doubtful accounts decreased during fi scal
2013 by ¥28.1 billion, or 1.4%, to ¥1,971.6 billion.
This decrease was due to a decrease in the volume
of sales in the fourth quarter of fi scal 2013.
Inventories increased during fi scal 2013 by ¥93.5
billion, or 5.8%, to ¥1,715.7 billion. This increase
was due mainly to the fl uctuations in foreign curren-
cy translation rates.
Total fi nance receivables, net increased during fi scal
2013 by ¥2,344.0 billion, or 24.1%, to ¥12,061.4 bil-
lion. This increase was due mainly to the fl uctuations in
foreign currency translation rates and an increase in the
number of fi nancing contracts. As of March 31, 2013,
fi nance receivables were geographically distributed as
follows: in North America 57.6%, in Europe 10.0%, in
Japan 9.9%, in Asia 9.5% and in Other 13.0%.
Marketable securities and other securities invest-
ments, including those included in current assets,
increased during fi scal 2013 by ¥1,387.6 billion, or
26.5%, refl ecting an increase in the fair values of
common stocks and purchase of marketable secu-
rities and security investments.
Property, plant and equipment increased during
fi scal 2013 by ¥615.8 billion, or 9.9%, primarily
refl ecting fl uctuations in foreign currency translation
rates and the increase in the capital expenditures,
partially offset by the impacts of depreciation charg-
es during the year.
Accounts and notes payable decreased during
fi scal 2013 by ¥128.8 billion, or 5.7%. This
decrease was due mainly to a decrease in produc-
tion volume in the fourth quarter of fi scal 2013.
Accrued expenses increased during fi scal 2013
by ¥357.0 billion, or 19.5%. This increase was due
mainly to the charge for costs related to the settle-
ment of the economic loss claims in the consolidat-
ed federal action in the U.S. and the increase of
product quality related expenses resulted from the
weakening of the Japanese yen at the end of fi scal
2013 against other currencies in comparison to the
prior fi scal year. Income taxes payable increased
during fi scal 2013 by ¥22.4 billion, or 16.8%, as a
result of refl ecting fl uctuations in foreign currency
translation rates.
Toyota’s total borrowings increased during fi scal
2013 by ¥2,126.2 billion, or 17.7%. Toyota’s short-
term borrowings consist of loans with a weighted-
average interest rate of 2.31% and commercial
paper with a weighted-average interest rate of
0.52%. Short-term borrowings increased during fi s-
cal 2013 by ¥638.8 billion, or 18.5%, to ¥4,089.5
billion. Toyota’s long-term debt consists of unse-
cured and secured loans, medium-term notes,
unsecured notes and long-term capital lease obliga-
tions with interest rates ranging from 0.00% to
27.30%, and maturity dates ranging from 2013 to
2050. The current portion of long-term debt
increased during fi scal 2013 by ¥191.8 billion, or
7.6%, to ¥2,704.4 billion and the non-current por-
tion increased by ¥1,295.5 billion, or 21.4%, to
¥7,337.8 billion. The increase in total borrowings
resulted from an increase in medium-term notes. As
of March 31, 2013, approximately 40% of long-term
debt was denominated in the U.S. dollars, 17% in
the Japanese yen, 13% in the Australian dollars, and
30% in other currencies. Toyota hedges interest rate
risk exposure of fi xed-rate borrowings by entering
into interest rate swaps. There are no material sea-
sonal variations in Toyota’s borrowings requirements.
As of March 31, 2013, Toyota’s total interest
bearing debt was 116.3% of Toyota Motor
Corporation shareholders’ equity, compared with
113.8% as of March 31, 2012.
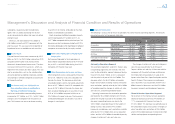
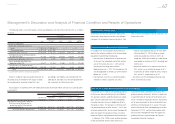
The following table provides information for credit
rating of Toyota’s short-term borrowing and long-
term debt from rating agencies, Standard & Poor’s
Ratings Group (S&P), Moody’s Investors Services
(Moody’s), and Rating and Investment Information,
Inc. (R&I), as of May 31, 2013. A credit rating is not
a recommendation to buy, sell or hold securities. A
credit rating may be subject to withdrawal or revi-
sion at any time. Each rating should be evaluated
separately of any other rating.
S&P Moody’s R&I
Short-term borrowing A-1+ P-1 —
Long-term debt AA- Aa3 AA+
Toyota’s unfunded pension liabilities of Japanese
plans decreased during fi scal 2013 by ¥48.6 billion,
or 8.8%, to ¥504.1 billion. On the other hand, the
liabilities of foreign plans increased during fi scal
2013 by ¥30.1 billion, or 24.4%, to ¥153.9 billion.
The unfunded amounts will be funded through
future cash contributions by Toyota or in some
cases will be settled on the retirement date of each
covered employee. The decrease in unfunded pen-
sion liabilities of the Japanese plans as of the end of
fi scal 2013 compared with the prior fi scal year end
refl ects mainly an increase in pension assets due to
rising equity security prices, despite an increase in
Management’s Discussion and Analysis of Financial Condition and Results of Operations
7,000
0
5,000
6,000
3,000
4,000
2,000
1,000
Liquid Assets*
(¥ Billion)
FY ’09 ’10 ’11 ’12 ’13
* Cash and cash equivalents, time deposits, marketable debt securities and
investment in monetary trust funds
15,000
0
60
10,000 40
12,500 50
7,500 30
2,500 10
5,000 20
0
Shareholders’ Equity and Equity Ratio
왎왎 Shareholders’ equity 쎲쎲 Equity ratio (Right scale)
(¥ Billion)
FY
(%)
’09 ’10 ’11 ’12 ’13
Selected Financial Summary (U.S. GAAP) Consolidated Segment Information Consolidated Quarterly Financial Summary Management’s Discussion and Analysis of Financial Condition and Results of Operations [20 of 26] Consolidated Financial Statements Notes to Consolidated Financial Statements
Management’s Annual Report on Internal Control over Financial Reporting Report of Independent Registered Public Accounting Firm