Toyota 2013 Annual Report Download - page 73
Download and view the complete annual report
Please find page 73 of the 2013 Toyota annual report below. You can navigate through the pages in the report by either clicking on the pages listed below, or by using the keyword search tool below to find specific information within the annual report.-
 1
1 -
2
-
3
-
4
-
5
-
6
-
7
-
8
-
9
-
10
-
11
-
12
-
13
-
14
-
15
-
16
-
17
-
18
-
19
-
20
-
21
-
22
-
23
-
24
-
25
-
26
-
27
-
28
-
29
-
30
-
31
-
32
-
33
-
34
-
35
-
36
-
37
-
38
-
39
-
40
-
41
-
42
-
43
-
44
-
45
-
46
-
47
-
48
-
49
-
50
-
51
-
52
-
53
-
54
-
55
-
56
-
57
-
58
-
59
-
60
-
61
-
62
-
 63
63 -
 64
64 -
 65
65 -
 66
66 -
 67
67 -
 68
68 -
 69
69 -
 70
70 -
 71
71 -
 72
72 -
 73
73 -
 74
74 -
 75
75 -
 76
76 -
 77
77 -
 78
78 -
 79
79 -
 80
80 -
 81
81 -
 82
82 -
 83
83 -
84
-
85
-
86
-
87
-
88
-
89
-
90
-
91
-
92
-
93
-
94
-
95
-
96
-
97
-
98
-
99
-
100
-
101
-
102
-
103
-
104
-
105
-
106
-
107
-
108
-
109
-
110
-
111
-
112
-
113
-
114
-
115
-
116
-
117
-
118
-
119
-
120
-
121
-
122
-
123
-
124
 |
 |

Toyota Global Vision President’s Message Launching a New Structure Special Feature Review of Operations
Consolidated Performance
Highlights
Management and
Corporate Information Investor InformationFinancial Section
Page 73
NextPrev
ContentsSearchPrint
ANNUAL REPORT 2013
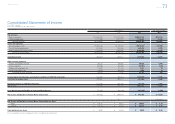
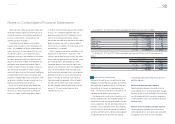
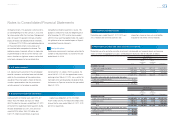
Consolidated Statements of Income
Toyota Motor Corporation
For the years ended March 31, 2011, 2012 and 2013
Yen in millions U.S. dollars in millions
2011 2012 2013 2013
Net revenues
Sales of products ¥17,820,520 ¥17,511,916 ¥20,914,150 $222,373
Financing operations 1,173,168 1,071,737 1,150,042 12,228
Total net revenues 18,993,688 18,583,653 22,064,192 234,601
Costs and expenses
Cost of products sold 15,985,783 15,795,918 18,010,569 191,500
Cost of fi nancing operations 629,543 592,646 630,426 6,703
Selling, general and administrative 1,910,083 1,839,462 2,102,309 22,353
Total costs and expenses 18,525,409 18,228,026 20,743,304 220,556
Operating income 468,279 355,627 1,320,888 14,045
Other income (expense)
Interest and dividend income 90,771 99,865 98,673 1,049
Interest expense (29,318) (22,922) (22,967) (244)
Foreign exchange gain, net 14,305 37,105 5,551 59
Other income (loss), net 19,253 (36,802) 1,504 16
Total other income (expense) 95,011 77,246 82,761 880
Income before income taxes and equity in earnings of affi liated companies 563,290 432,873 1,403,649 14,925
Provision for income taxes 312,821 262,272 551,686 5,866
Equity in earnings of affi liated companies 215,016 197,701 231,519 2,461
Net income 465,485 368,302 1,083,482 11,520
Less: Net income attributable to noncontrolling interests (57,302) (84,743) (121,319) (1,290)
Net income attributable to Toyota Motor Corporation ¥ 408,183 ¥ 283,559 ¥ 962,163 $ 10,230
Yen U.S. dollars
Net income attributable to Toyota Motor Corporation per share
— Basic ¥ 130.17 ¥ 90.21 ¥ 303.82 $ 3.23
— Diluted ¥ 130.16 ¥ 90.20 ¥ 303.78 $ 3.23
Cash dividends per share ¥ 50.00 ¥ 50.00 ¥ 90.00 $ 0.96
The accompanying notes are an integral part of these consolidated fi nancial statements.
Selected Financial Summary (U.S. GAAP) Consolidated Segment Information Consolidated Quarterly Financial Summary Management’s Discussion and Analysis of Financial Condition and Results of Operations Consolidated Financial Statements [2 of 6] Notes to Consolidated Financial Statements
Management’s Annual Report on Internal Control over Financial Reporting Report of Independent Registered Public Accounting Firm