Electronic Arts 2014 Annual Report Download - page 106
Download and view the complete annual report
Please find page 106 of the 2014 Electronic Arts annual report below. You can navigate through the pages in the report by either clicking on the pages listed below, or by using the keyword search tool below to find specific information within the annual report.-
 1
1 -
2
-
3
-
4
-
5
-
6
-
7
-
8
-
9
-
10
-
11
-
12
-
13
-
14
-
15
-
16
-
17
-
18
-
19
-
20
-
21
-
22
-
23
-
24
-
25
-
26
-
27
-
28
-
29
-
30
-
31
-
32
-
33
-
34
-
35
-
36
-
37
-
38
-
39
-
40
-
41
-
42
-
43
-
44
-
45
-
46
-
47
-
48
-
49
-
50
-
51
-
52
-
53
-
54
-
55
-
56
-
57
-
58
-
59
-
60
-
61
-
62
-
63
-
64
-
65
-
66
-
67
-
68
-
69
-
70
-
71
-
72
-
73
-
74
-
75
-
76
-
77
-
78
-
79
-
80
-
81
-
82
-
83
-
84
-
85
-
86
-
87
-
88
-
89
-
90
-
91
-
92
-
93
-
94
-
95
-
 96
96 -
 97
97 -
 98
98 -
 99
99 -
 100
100 -
 101
101 -
 102
102 -
 103
103 -
 104
104 -
 105
105 -
 106
106 -
 107
107 -
 108
108 -
 109
109 -
 110
110 -
 111
111 -
 112
112 -
 113
113 -
 114
114 -
 115
115 -
 116
116 -
117
-
118
-
119
-
120
-
121
-
122
-
123
-
124
-
125
-
126
-
127
-
128
-
129
-
130
-
131
-
132
-
133
-
134
-
135
-
136
-
137
-
138
-
139
-
140
-
141
-
142
-
143
-
144
-
145
-
146
-
147
-
148
-
149
-
150
-
151
-
152
-
153
-
154
-
155
-
156
-
157
-
158
-
159
-
160
-
161
-
162
-
163
-
164
-
165
-
166
-
167
-
168
-
169
-
170
-
171
-
172
-
173
-
174
-
175
-
176
-
177
-
178
-
179
-
180
-
181
-
182
-
183
-
184
-
185
-
186
-
187
-
188
 |
 |

reflects the deferral and recognition of revenue in periods subsequent to the date of sale due to U.S. GAAP while
Net Revenue before Revenue Deferral by Revenue Composition does not, and (2) both measures contain a
different aggregation of sales from one another. For instance, Service and other revenue does not include a
portion of our full-game digital download and mobile sales that are fully included in our Digital revenue. Further,
Service and other revenue includes all of our revenue associated with MMO games while software sales
associated with our MMOs are included in either Digital revenue or Packaged goods and other revenue
depending on whether the sale was a full-game digital download or a packaged goods sale.
Comparison of Fiscal Year 2014 to Fiscal Year 2013
Net Revenue
For fiscal year 2014, Net Revenue was $3,575 million and decreased $222 million, or 6 percent, as compared to
fiscal year 2013. This decrease was driven by a $745 million decrease in revenue primarily from the Mass Effect,
Madden NFL, Medal of Honor, The Sims, and FIFA Street franchises. This decrease was partially offset by a
$523 million increase in revenue primarily from the Battlefield, SimCity, Crysis franchises, and The Simpsons:
Tapped Out.
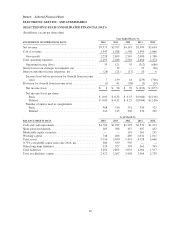
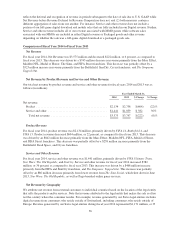
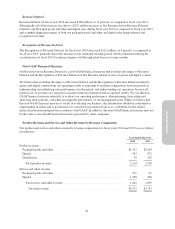
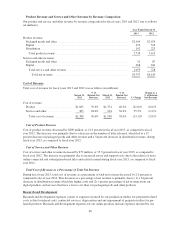
Net Revenue by Product Revenue and Service and Other Revenue
Our total net revenue by product revenue and service and other revenue for fiscal years 2014 and 2013 was as
follows (in millions):
Year Ended March 31,
2014 2013 $ Change % Change
Net revenue:
Product ................................................ $2,134 $2,738 $(604) (22)%
Service and other ........................................ $1,441 $1,059 $ 382 36%
Total net revenue ...................................... $3,575 $3,797 $(222) (6)%
Product Revenue
For fiscal year 2014, product revenue was $2,134 million, primarily driven by FIFA 14,Battlefield 4, and
FIFA 13. Product revenue decreased $604 million, or 22 percent, as compared to fiscal year 2013. This decrease
was driven by an $842 million decrease primarily from the Mass Effect, Madden NFL, FIFA, Medal of Honor,
and FIFA Street franchises. This decrease was partially offset by a $238 million increase primarily from the
Battlefield, Dead Space, and Crysis franchises.
Service and Other Revenue
For fiscal year 2014, service and other revenue was $1,441 million, primarily driven by FIFA Ultimate Team,
Star Wars: The Old Republic, and SimCity. Service and other revenue for fiscal year 2014 increased $382
million, or 36 percent, as compared to fiscal year 2013. This increase was driven by a $468 million increase
primarily from the FIFA and SimCity franchises, and The Simpsons: Tapped Out. This increase was partially
offset by an $86 million decrease primarily from lower revenue from The Sims Social, which shut down in June
2013, Star Wars: The Old Republic, as well as Pogo-branded online game services.
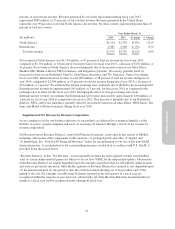
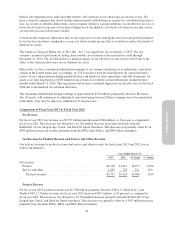
Net Revenue by Geography
We attribute net revenue from external customers to individual countries based on the location of the legal entity
that sells the products and/or services. Note that revenue attributed to the legal entity that makes the sale is often
not the country where the consumer resides. For example, revenue generated by our Swiss legal entities includes
digital revenue from consumers who reside outside of Switzerland, including consumers who reside outside of
Europe. Revenue generated by our Swiss legal entities during fiscal year 2014 represented $1,171 million, or 33
36