Electronic Arts 2014 Annual Report Download - page 51
Download and view the complete annual report
Please find page 51 of the 2014 Electronic Arts annual report below. You can navigate through the pages in the report by either clicking on the pages listed below, or by using the keyword search tool below to find specific information within the annual report.-
 1
1 -
2
-
3
-
4
-
5
-
6
-
7
-
8
-
9
-
10
-
11
-
12
-
13
-
14
-
15
-
16
-
17
-
18
-
19
-
20
-
21
-
22
-
23
-
24
-
25
-
26
-
27
-
28
-
29
-
30
-
31
-
32
-
33
-
34
-
35
-
36
-
37
-
38
-
39
-
40
-
 41
41 -
 42
42 -
 43
43 -
 44
44 -
 45
45 -
 46
46 -
 47
47 -
 48
48 -
 49
49 -
 50
50 -
 51
51 -
 52
52 -
 53
53 -
 54
54 -
 55
55 -
 56
56 -
 57
57 -
 58
58 -
 59
59 -
 60
60 -
 61
61 -
62
-
63
-
64
-
65
-
66
-
67
-
68
-
69
-
70
-
71
-
72
-
73
-
74
-
75
-
76
-
77
-
78
-
79
-
80
-
81
-
82
-
83
-
84
-
85
-
86
-
87
-
88
-
89
-
90
-
91
-
92
-
93
-
94
-
95
-
96
-
97
-
98
-
99
-
100
-
101
-
102
-
103
-
104
-
105
-
106
-
107
-
108
-
109
-
110
-
111
-
112
-
113
-
114
-
115
-
116
-
117
-
118
-
119
-
120
-
121
-
122
-
123
-
124
-
125
-
126
-
127
-
128
-
129
-
130
-
131
-
132
-
133
-
134
-
135
-
136
-
137
-
138
-
139
-
140
-
141
-
142
-
143
-
144
-
145
-
146
-
147
-
148
-
149
-
150
-
151
-
152
-
153
-
154
-
155
-
156
-
157
-
158
-
159
-
160
-
161
-
162
-
163
-
164
-
165
-
166
-
167
-
168
-
169
-
170
-
171
-
172
-
173
-
174
-
175
-
176
-
177
-
178
-
179
-
180
-
181
-
182
-
183
-
184
-
185
-
186
-
187
-
188
 |
 |

Proxy Statement
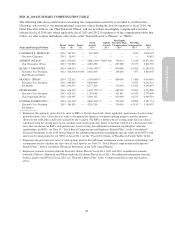
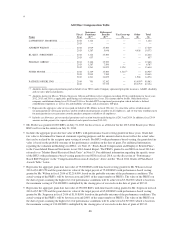
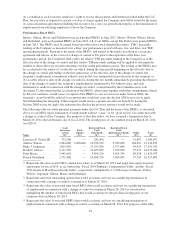
FISCAL 2014 SUMMARY COMPENSATION TABLE
The following table shows information concerning the compensation earned by or awarded to our Executive
Chairman, who served as our interim principal executive officer during the first two quarters of fiscal 2014, our
Chief Executive Officer, our Chief Financial Officer, and our next three most highly compensated executive
officers for fiscal 2014 and, where applicable, fiscal 2013 and 2012. For purposes of the compensation tables that
follow, we refer to these individuals collectively as the “Named Executive Officers” or “NEOs”.
Name and Principal Position
Fiscal
Year
Salary
($)
Bonus
($)
Stock
Awards
($)(1)
Option
Awards
($)(2)
Non-Equity
Incentive Plan
Compensation
($)(3)
All Other
Compensation
($)(4)
Total
($)
LAWRENCE F. PROBST III ........ 2014 764,577 — 261,200(5) — — 1,124 1,026,901
Executive Chairman 2013 39,615 — — — — — 39,615
ANDREW WILSON .............. 2014 674,038 — 3,896,250(6)(7) 8,607,400 780,474 17,219 13,975,381
Chief Executive Officer 2013 510,865 — 4,283,250 — 827,488 10,373 5,631,976
BLAKE J. JORGENSEN ........... 2014 666,154 — 9,766,750(6)(8) — 840,000 16,424 11,289,328
Executive Vice President, 2013 362,500 350,000 2,842,000 — 269,208 657 3,824,365
Chief Financial Officer
FRANK D. GIBEAU .............. 2014 722,115 — 5,195,000(6)(9) — 680,000 17,486 6,614,601
Executive Vice President, 2013 694,923 — 5,609,000 — — 8,787 6,312,710
EA Mobile 2012 624,577 — 8,277,500 — 775,000 13,614 9,690,691
PETER MOORE .................. 2014 646,154 — 3,376,750(6)(10) — 685,000 24,965 4,732,869
Executive Vice President, 2013 628,155 — 1,716,000 — 423,811 10,443 2,778,409
Chief Operating Officer 2012 616,385 — 5,494,132 — 825,000 14,274 6,949,791
PATRICK SÖDERLUND(11) ........ 2014 634,518 — 3,896,250(6)(12) — 725,000 95,983 5,351,751
Executive Vice President, 2013 584,583 — 4,283,250 — 259,050 67,154 5,194,037
EA Studios
(1) Represents the aggregate grant date fair value of RSUs with time-based and, where applicable, performance-based vesting
granted in those years. Grant date fair value is determined for financial statement reporting purposes and the amounts
shown do not reflect the actual value realized by the recipient. For RSUs with time-based vesting, grant date fair value is
calculated using the closing price of our common stock on the grant date. Refer to footnote 6 below for a discussion of the
fair value calculation for RSUs with performance-based vesting. For additional information regarding the valuation
methodology for RSUs, see Note 15, “Stock-Based Compensation and Employee Benefit Plans”, to the Consolidated
Financial Statements in our 2014 Annual Report. For additional information regarding the specific terms of the RSUs with
time-based vesting granted to our NEOs in fiscal 2014, see the “Fiscal 2014 Grants of Plan-Based Awards Table” below.
(2) Represents the grant date fair value of stock options granted. For additional information on the valuation methodology and
assumptions used to calculate the fair value of stock options, see Note 15, “Stock-Based Compensation and Employee
Benefit Plans”, of the Consolidated Financial Statements in our 2014 Annual Report.
(3) Represents amounts awarded under the Executive Bonus Plan for fiscal 2014, 2013 and 2012, in addition to amounts
awarded to Messrs. Söderlund and Wilson under the EA Bonus Plan in fiscal 2013. For additional information about the
bonuses paid to our NEOs in fiscal 2014, see “Executive Bonus Plan” in the “Compensation Discussion and Analysis”
above.
45