Electronic Arts 2014 Annual Report Download - page 116
Download and view the complete annual report
Please find page 116 of the 2014 Electronic Arts annual report below. You can navigate through the pages in the report by either clicking on the pages listed below, or by using the keyword search tool below to find specific information within the annual report.-
 1
1 -
2
-
3
-
4
-
5
-
6
-
7
-
8
-
9
-
10
-
11
-
12
-
13
-
14
-
15
-
16
-
17
-
18
-
19
-
20
-
21
-
22
-
23
-
24
-
25
-
26
-
27
-
28
-
29
-
30
-
31
-
32
-
33
-
34
-
35
-
36
-
37
-
38
-
39
-
40
-
41
-
42
-
43
-
44
-
45
-
46
-
47
-
48
-
49
-
50
-
51
-
52
-
53
-
54
-
55
-
56
-
57
-
58
-
59
-
60
-
61
-
62
-
63
-
64
-
65
-
66
-
67
-
68
-
69
-
70
-
71
-
72
-
73
-
74
-
75
-
76
-
77
-
78
-
79
-
80
-
81
-
82
-
83
-
84
-
85
-
86
-
87
-
88
-
89
-
90
-
91
-
92
-
93
-
94
-
95
-
96
-
97
-
98
-
99
-
100
-
101
-
102
-
103
-
104
-
105
-
 106
106 -
 107
107 -
 108
108 -
 109
109 -
 110
110 -
 111
111 -
 112
112 -
 113
113 -
 114
114 -
 115
115 -
 116
116 -
 117
117 -
 118
118 -
 119
119 -
 120
120 -
 121
121 -
 122
122 -
 123
123 -
 124
124 -
 125
125 -
 126
126 -
127
-
128
-
129
-
130
-
131
-
132
-
133
-
134
-
135
-
136
-
137
-
138
-
139
-
140
-
141
-
142
-
143
-
144
-
145
-
146
-
147
-
148
-
149
-
150
-
151
-
152
-
153
-
154
-
155
-
156
-
157
-
158
-
159
-
160
-
161
-
162
-
163
-
164
-
165
-
166
-
167
-
168
-
169
-
170
-
171
-
172
-
173
-
174
-
175
-
176
-
177
-
178
-
179
-
180
-
181
-
182
-
183
-
184
-
185
-
186
-
187
-
188
 |
 |

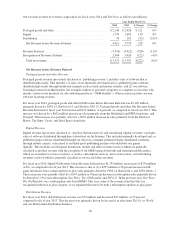
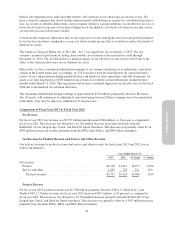
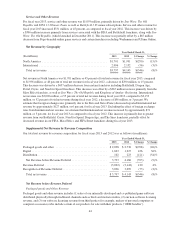
Product Revenue and Service and Other Revenue by Revenue Composition
Our product and service and other revenue by revenue composition for fiscal years 2013 and 2012 was as follows
(in millions):
Year Ended March 31
2013 2012
Product revenue:
Packaged goods and other ............................................... $2,164 $2,674
Digital ............................................................... 472 518
Distribution ........................................................... 102 223
Total product revenue ................................................. 2,738 3,415
Service and other revenue:
Packaged goods and other ............................................... 91 87
Digital ............................................................... 968 641
Total service and other revenue ......................................... 1,059 728
Total net revenue .................................................. $3,797 $4,143
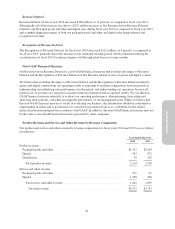
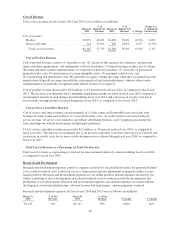
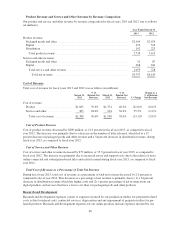
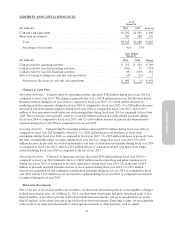
Cost of Revenue
Total cost of revenue for fiscal years 2013 and 2012 was as follows (in millions):
March 31,
2013
%of
Related Net
Revenue
March 31,
2012
%of
Related Net
Revenue % Change
Change as a
% of Related
Net Revenue
Cost of revenue:
Product ........................ $1,085 39.6% $1,374 40.2% (21.0)% (0.6)%
Service and other ................ 303 28.6% 224 30.8% 35.3% (2.2)%
Total cost of revenue ........... $1,388 36.6% $1,598 38.6% (13.1)% (2.0)%
Cost of Product Revenue
Cost of product revenue decreased by $289 million, or 21.0 percent in fiscal year 2013, as compared to fiscal
year 2012. The decrease was primarily due to a decrease in the number of titles released, which led to a 19
percent decrease in packaged goods and other revenue and a 54 percent decrease in distribution revenue, during
fiscal year 2013, as compared to fiscal year 2012.
Cost of Service and Other Revenue
Cost of service and other revenue increased by $79 million, or 35.3 percent in fiscal year 2013, as compared to
fiscal year 2012. The increase was primarily due to increased server and support costs due to the release of more
online-connected and subscription-based titles and related content during fiscal year 2013, as compared to fiscal
year 2012.
Total Cost of Revenue as a Percentage of Total Net Revenue
During fiscal year 2013, total cost of revenue as a percentage of total net revenue decreased by 2.0 percent as
compared to fiscal year 2012. This decrease as a percentage of net revenue is primarily due to (1) a 54 percent
decrease in distribution revenue which has higher costs and (2) a greater percentage of net revenue from our
digital products and services that have a lower cost than our packaged goods and other products.
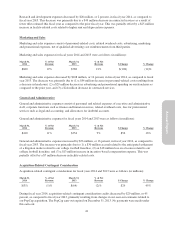
Research and Development
Research and development expenses consist of expenses incurred by our production studios for personnel-related
costs, related overhead costs, contracted services, depreciation and any impairment of prepaid royalties for pre-
launch products. Research and development expenses for our online products include expenses incurred by our
46