Electronic Arts 2014 Annual Report Download - page 159
Download and view the complete annual report
Please find page 159 of the 2014 Electronic Arts annual report below. You can navigate through the pages in the report by either clicking on the pages listed below, or by using the keyword search tool below to find specific information within the annual report.-
 1
1 -
2
-
3
-
4
-
5
-
6
-
7
-
8
-
9
-
10
-
11
-
12
-
13
-
14
-
15
-
16
-
17
-
18
-
19
-
20
-
21
-
22
-
23
-
24
-
25
-
26
-
27
-
28
-
29
-
30
-
31
-
32
-
33
-
34
-
35
-
36
-
37
-
38
-
39
-
40
-
41
-
42
-
43
-
44
-
45
-
46
-
47
-
48
-
49
-
50
-
51
-
52
-
53
-
54
-
55
-
56
-
57
-
58
-
59
-
60
-
61
-
62
-
63
-
64
-
65
-
66
-
67
-
68
-
69
-
70
-
71
-
72
-
73
-
74
-
75
-
76
-
77
-
78
-
79
-
80
-
81
-
82
-
83
-
84
-
85
-
86
-
87
-
88
-
89
-
90
-
91
-
92
-
93
-
94
-
95
-
96
-
97
-
98
-
99
-
100
-
101
-
102
-
103
-
104
-
105
-
106
-
107
-
108
-
109
-
110
-
111
-
112
-
113
-
114
-
115
-
116
-
117
-
118
-
119
-
120
-
121
-
122
-
123
-
124
-
125
-
126
-
127
-
128
-
129
-
130
-
131
-
132
-
133
-
134
-
135
-
136
-
137
-
138
-
139
-
140
-
141
-
142
-
143
-
144
-
145
-
146
-
147
-
148
-
 149
149 -
 150
150 -
 151
151 -
 152
152 -
 153
153 -
 154
154 -
 155
155 -
 156
156 -
 157
157 -
 158
158 -
 159
159 -
 160
160 -
 161
161 -
 162
162 -
 163
163 -
 164
164 -
 165
165 -
 166
166 -
 167
167 -
 168
168 -
 169
169 -
170
-
171
-
172
-
173
-
174
-
175
-
176
-
177
-
178
-
179
-
180
-
181
-
182
-
183
-
184
-
185
-
186
-
187
-
188
 |
 |

Annual Report
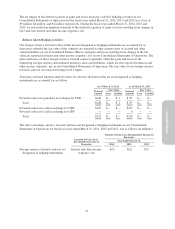
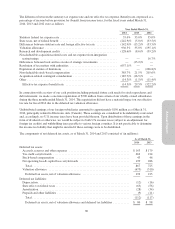
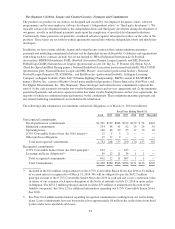
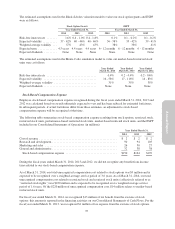
The differences between the statutory tax expense rate and our effective tax expense (benefit) rate, expressed as a
percentage of income before provision for (benefit from) income taxes, for the fiscal years ended March 31,
2014, 2013 and 2012 were as follows:
Year Ended March 31,
2014 2013 2012
Statutory federal tax expense rate ....................................... 35.0% 35.0% 35.0%
State taxes, net of federal benefit ....................................... (242.9)% (5.0)% (33.5)%
Differences between statutory rate and foreign effective tax rate .............. (142.9)% (15.2)% (33.5)%
Valuation allowance ................................................. 936.5% 35.0% (195.1)%
Research and development credits ...................................... (128.6)% (8.6)% (39.2)%
Non-deductible acquisition-related costs and tax expense from integration
restructurings .................................................... — — 16.7%
Differences between book and tax on sale of strategic investments ............ — (15.2)% —
Resolution of tax matters with authorities ................................ (657.1)% — —
Expiration of statutes of limitations ..................................... — — (266.8)%
Non-deductible stock-based compensation ............................... 385.7% 21.5% 205.6%
Acquisition-related contingent consideration .............................. (185.7)% (16.5)% —
Other ............................................................. (14.3)% (1.5)% (11.4)%
Effective tax expense (benefit) rate ................................... (14.3)% 29.5% (322.2)%
In connection with a review of our cash position including potential future cash needs for stock repurchases and
debt retirement, we made a one-time repatriation of $700 million from certain of our wholly-owned subsidiaries
during the three months ended March 31, 2014. This repatriation did not have a material impact on our effective
tax rate for fiscal 2014 due to the deferred tax valuation allowance.
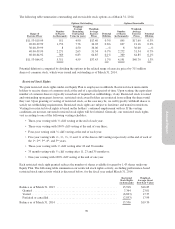
Undistributed earnings of our foreign subsidiaries amounted to approximately $150 million as of March 31,
2014, principally related to Electronic Arts (Canada). Those earnings are considered to be indefinitely reinvested
and, accordingly, no U.S. income taxes have been provided thereon. Upon distribution of those earnings in the
form of dividends or otherwise, we would be subject to both U.S. income taxes (subject to an adjustment for
foreign tax credits) and withholding taxes payable to various foreign countries. It is not practicable to determine
the income tax liability that might be incurred if these earnings were to be distributed.
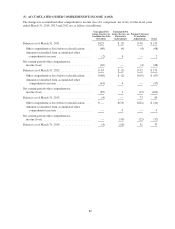
The components of net deferred tax assets, as of March 31, 2014 and 2013 consisted of (in millions):
As of March 31,
2014 2013
Deferred tax assets:
Accruals, reserves and other expenses ......................................... $163 $179
Tax credit carryforwards .................................................... 462 214
Stock-based compensation .................................................. 43 46
Net operating loss & capital loss carryforwards .................................. 199 286
Total .................................................................. 867 725
Valuation allowance ....................................................... (675) (510)
Deferred tax assets, net of valuation allowance ................................ 192 215
Deferred tax liabilities:
Depreciation .............................................................. (12) (16)
State effect on federal taxes .................................................. (63) (56)
Amortization ............................................................. (28) (34)
Prepaids and other liabilities ................................................. (9) (11)
Total .................................................................. (112) (117)
Deferred tax assets, net of valuation allowance and deferred tax liabilities ........... $ 80 $ 98
89