Electronic Arts 2014 Annual Report Download - page 108
Download and view the complete annual report
Please find page 108 of the 2014 Electronic Arts annual report below. You can navigate through the pages in the report by either clicking on the pages listed below, or by using the keyword search tool below to find specific information within the annual report.-
 1
1 -
2
-
3
-
4
-
5
-
6
-
7
-
8
-
9
-
10
-
11
-
12
-
13
-
14
-
15
-
16
-
17
-
18
-
19
-
20
-
21
-
22
-
23
-
24
-
25
-
26
-
27
-
28
-
29
-
30
-
31
-
32
-
33
-
34
-
35
-
36
-
37
-
38
-
39
-
40
-
41
-
42
-
43
-
44
-
45
-
46
-
47
-
48
-
49
-
50
-
51
-
52
-
53
-
54
-
55
-
56
-
57
-
58
-
59
-
60
-
61
-
62
-
63
-
64
-
65
-
66
-
67
-
68
-
69
-
70
-
71
-
72
-
73
-
74
-
75
-
76
-
77
-
78
-
79
-
80
-
81
-
82
-
83
-
84
-
85
-
86
-
87
-
88
-
89
-
90
-
91
-
92
-
93
-
94
-
95
-
96
-
97
-
 98
98 -
 99
99 -
 100
100 -
 101
101 -
 102
102 -
 103
103 -
 104
104 -
 105
105 -
 106
106 -
 107
107 -
 108
108 -
 109
109 -
 110
110 -
 111
111 -
 112
112 -
 113
113 -
 114
114 -
 115
115 -
 116
116 -
 117
117 -
 118
118 -
119
-
120
-
121
-
122
-
123
-
124
-
125
-
126
-
127
-
128
-
129
-
130
-
131
-
132
-
133
-
134
-
135
-
136
-
137
-
138
-
139
-
140
-
141
-
142
-
143
-
144
-
145
-
146
-
147
-
148
-
149
-
150
-
151
-
152
-
153
-
154
-
155
-
156
-
157
-
158
-
159
-
160
-
161
-
162
-
163
-
164
-
165
-
166
-
167
-
168
-
169
-
170
-
171
-
172
-
173
-
174
-
175
-
176
-
177
-
178
-
179
-
180
-
181
-
182
-
183
-
184
-
185
-
186
-
187
-
188
 |
 |

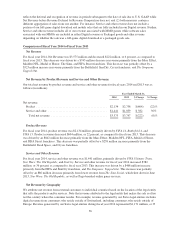
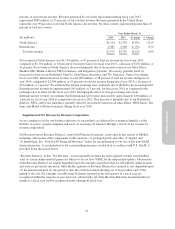
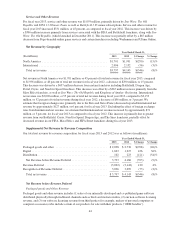
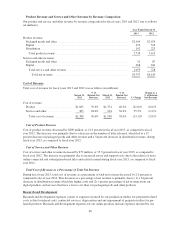
Our total net revenue by revenue composition for fiscal years 2014 and 2013 was as follows (in millions):
Year Ended March 31,
2014 2013 $ Change % Change
Packaged goods and other .................................... $2,149 $ 2,028 $ 121 6%
Digital ................................................... 1,793 1,663 130 8%
Distribution ............................................... 79 102 (23) (23)%
Net Revenue before Revenue Deferral ........................ 4,021 3,793 228 6%
Revenue Deferral .......................................... (3,350) (3,022) (328) (11)%
Recognition of Revenue Deferral .............................. 2,904 3,026 (122) (4)%
Total net revenue ......................................... $3,575 $ 3,797 $(222) (6)%
Net Revenue before Revenue Deferral
Packaged goods and other Revenue
Packaged goods revenue (previously disclosed as “publishing revenue”) includes sales of software that is
distributed physically. This includes (1) sales of our internally-developed and co-published game software
distributed physically through traditional channels such as brick and mortar retailers, and (2) our software
licensing revenue from third parties (for example, makers of personal computers or computer accessories) who
include certain of our products for sale with their products (“OEM bundles”). Other revenue includes our non-
software licensing revenue.
For fiscal year 2014, packaged goods and other Net Revenue before Revenue Deferral was $2,149 million,
primarily driven by FIFA 14,Battlefield 4, and Madden NFL 25. Packaged goods and other Net Revenue before
Revenue Deferral for fiscal year 2014 increased $121 million, or 6 percent, as compared to fiscal year 2013. This
increase was driven by a $652 million increase in sales primarily from the Battlefield and FIFA franchises, and
Titanfall. This increase was partially offset by a $532 million decrease in sales primarily from the Medal of
Honor, The Sims, Crysis, and Dead Space franchises.
Digital Revenue
Digital revenue (previously disclosed as “wireless, Internet-derived, and advertising (digital) revenue”) includes
sales of software distributed through direct download via the Internet. This includes internally-developed and co-
published game software distributed through our direct-to-consumer platform Origin, distributed wirelessly
through mobile carriers, or licensed to our third-party publishing partners who distribute our games
digitally. This includes our full-game downloads, mobile and tablet revenue (each of which are generally
classified as product revenue with the exception of our MMO game downloads and freemium mobile games,
which are classified as service revenue), as well as subscription services, micro-transactions, and advertising
revenues (each of which is generally classified as service and other revenue).
For fiscal year 2014, digital Net Revenue before Revenue Deferral was $1,793 million, an increase of $130 million,
or 8%, as compared to fiscal year 2013. This increase is due to (1) a $297 million or 24 percent increase in full-
game download, extra content and free-to-play sales primarily driven by FIFA 14,Battlefield 4,andFIFA Online 3.
These increases were partially offset by a $167 million or 39 percent decrease in subscription sales primarily driven
by Battlefield 3 Premium subscription, Star Wars: The Old Republic and FIFA 13. In the previous year, Star Wars:
The Old Republic was a subscription-only based MMO. This year, some of the revenue from this title was
recognized in the free-to-play category as we expanded this title to be both a subscription and free-to-play game.
Distribution Revenue
For fiscal year 2014, distribution net revenue was $79 million and decreased $23 million, or 23 percent,
compared to fiscal year 2013. This decrease was primarily driven by decreases in sales from The Secret World
and our Switzerland distribution business.
38