Electronic Arts 2014 Annual Report Download - page 52
Download and view the complete annual report
Please find page 52 of the 2014 Electronic Arts annual report below. You can navigate through the pages in the report by either clicking on the pages listed below, or by using the keyword search tool below to find specific information within the annual report.-
 1
1 -
2
-
3
-
4
-
5
-
6
-
7
-
8
-
9
-
10
-
11
-
12
-
13
-
14
-
15
-
16
-
17
-
18
-
19
-
20
-
21
-
22
-
23
-
24
-
25
-
26
-
27
-
28
-
29
-
30
-
31
-
32
-
33
-
34
-
35
-
36
-
37
-
38
-
39
-
40
-
41
-
 42
42 -
 43
43 -
 44
44 -
 45
45 -
 46
46 -
 47
47 -
 48
48 -
 49
49 -
 50
50 -
 51
51 -
 52
52 -
 53
53 -
 54
54 -
 55
55 -
 56
56 -
 57
57 -
 58
58 -
 59
59 -
 60
60 -
 61
61 -
 62
62 -
63
-
64
-
65
-
66
-
67
-
68
-
69
-
70
-
71
-
72
-
73
-
74
-
75
-
76
-
77
-
78
-
79
-
80
-
81
-
82
-
83
-
84
-
85
-
86
-
87
-
88
-
89
-
90
-
91
-
92
-
93
-
94
-
95
-
96
-
97
-
98
-
99
-
100
-
101
-
102
-
103
-
104
-
105
-
106
-
107
-
108
-
109
-
110
-
111
-
112
-
113
-
114
-
115
-
116
-
117
-
118
-
119
-
120
-
121
-
122
-
123
-
124
-
125
-
126
-
127
-
128
-
129
-
130
-
131
-
132
-
133
-
134
-
135
-
136
-
137
-
138
-
139
-
140
-
141
-
142
-
143
-
144
-
145
-
146
-
147
-
148
-
149
-
150
-
151
-
152
-
153
-
154
-
155
-
156
-
157
-
158
-
159
-
160
-
161
-
162
-
163
-
164
-
165
-
166
-
167
-
168
-
169
-
170
-
171
-
172
-
173
-
174
-
175
-
176
-
177
-
178
-
179
-
180
-
181
-
182
-
183
-
184
-
185
-
186
-
187
-
188
 |
 |

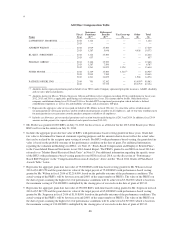
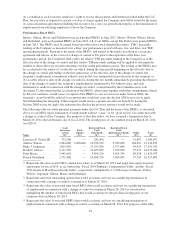
(4)
All Other Compensation Table
Name
Fiscal
Year
Insurance
Premiums
($)(A)
Retirement
Benefits
($)(B)
Tax Gross-up
($)
Other
($)
Total
($)
LAWRENCE F. PROBST III .............. 2014 1,124 — — — 1,124
2013 — — — — —
ANDREW WILSON .................... 2014 1,919 15,300 — — 17,219
2013 1,287 5,048 — 4,038 10,373
BLAKE J. JORGENSEN ................. 2014 1,124 15,300 — — 16,424
2013 657 — — — 657
FRANK D. GIBEAU .................... 2014 2,186 15,300 — — 17,486
2013 1,287 7,500 — — 8,787
2012 1,261 11,025 1,328 — 13,614
PETER MOORE ........................ 2014 6,149 15,300 3,516(C) — 24,965
2013 2,943 7,500 — — 10,443
2012 1,261 11,025 — 1,988 14,274
PATRICK SÖDERLUND ................ 2014 791 32,142 — 63,050(D) 95,983
2013 — 37,779 — 29,375(D) 67,154
(A) Amounts shown represent premiums paid on behalf of our NEOs under Company sponsored group life insurance, AD&D, disability
and executive physical programs.
(B) Amounts shown for Messrs. Wilson, Jorgensen, Gibeau and Moore reflect company-matching 401(k) contributions for fiscal years
2012, 2013 and 2014, as applicable, paid during each subsequent fiscal year. The amount shown for Mr. Söderlund reflects
company contributions during fiscal 2013 and 2014 to a Swedish ITP2 occupational pension plan, which includes a defined
contribution component, as well as life and disability coverage, and an alternative ITP plan.
(C) Represents the aggregate value of taxes paid on behalf of Mr. Moore in fiscal 2014 for: (1) a one-time airfare reimbursement;
(2) participation in video game purchase and/or reimbursement program available to all employees; and (3) one-time reimbursement
for participation in next-generation console purchase program available to all employees.
(D) Includes car allowance, private medical premiums and vacation benefits paid during fiscal 2013 and 2014. In addition, fiscal 2014
amounts include payouts for expired sabbatical and expired vacation ($30,415).
(5) Mr. Probst was granted 10,000 RSUs on July 31, 2013 for his services as a Director for the 2013-2014 Board year. These
RSUs will vest in the entirety on July 31, 2014.
(6) Includes the aggregate grant date fair value of RSUs with performance-based vesting granted in those years. Grant date
fair value is determined for financial statement reporting purposes and the amounts shown do not reflect the actual value
that can be realized by the recipient upon vesting of awards. For RSUs with performance-based vesting, the grant date fair
value is based on the probable outcome of the performance condition on the date of grant. For additional information
regarding the valuation methodology for RSUs, see Note 15, “Stock-Based Compensation and Employee Benefit Plans”,
to the Consolidated Financial Statements in our 2014 Annual Report. The PRSUs granted to our NEOs in fiscal 2014 are
referred to as “Market-Based Restricted Stock Units” in Note 15. For additional information regarding the specific terms
of the RSUs with performance-based vesting granted to our NEOs in fiscal 2014, see the discussion of “Performance-
Based RSU Program” in the “Compensation Discussion & Analysis” above and the “Fiscal 2014 Grants of Plan-Based
Awards Table” below.
(7) Represents the aggregate grant date fair value of 75,000 RSUs with time-based vesting granted to Mr. Wilson in fiscal
2014 of $1,682,250 and the grant date fair value of the target payout of 75,000 RSUs with performance-based vesting
granted to Mr. Wilson in fiscal 2014 of $2,214,000, based on the probable outcome of the performance conditions. The
actual vesting of the PRSUs will be between zero and 200% of the target number of PRSUs. The value of the PRSUs on
the date of grant assuming the highest level of performance conditions will be achieved is $3,364,500, which is based on
the maximum vesting of 150,000 RSUs multiplied by the closing price of our stock on the date of grant of $22.43.
(8) Represents the aggregate grant date fair value of 290,000 RSUs with time-based vesting granted to Mr. Jorgensen in fiscal
2014 of $7,847,950 and the grant date fair value of the target payout of 65,000 RSUs with performance-based vesting
granted to Mr. Jorgensen in fiscal 2014 of $1,918,800, based on the probable outcome of the performance conditions. The
actual vesting of the PRSUs will be between zero and 200% of the target number of PRSUs. The value of the PRSUs on
the date of grant assuming the highest level of performance conditions will be achieved is $2,915,900, which is based on
the maximum vesting of 130,000 RSUs multiplied by the closing price of our stock on the date of grant of $22.43.
46