Electronic Arts 2014 Annual Report Download - page 114
Download and view the complete annual report
Please find page 114 of the 2014 Electronic Arts annual report below. You can navigate through the pages in the report by either clicking on the pages listed below, or by using the keyword search tool below to find specific information within the annual report.-
 1
1 -
2
-
3
-
4
-
5
-
6
-
7
-
8
-
9
-
10
-
11
-
12
-
13
-
14
-
15
-
16
-
17
-
18
-
19
-
20
-
21
-
22
-
23
-
24
-
25
-
26
-
27
-
28
-
29
-
30
-
31
-
32
-
33
-
34
-
35
-
36
-
37
-
38
-
39
-
40
-
41
-
42
-
43
-
44
-
45
-
46
-
47
-
48
-
49
-
50
-
51
-
52
-
53
-
54
-
55
-
56
-
57
-
58
-
59
-
60
-
61
-
62
-
63
-
64
-
65
-
66
-
67
-
68
-
69
-
70
-
71
-
72
-
73
-
74
-
75
-
76
-
77
-
78
-
79
-
80
-
81
-
82
-
83
-
84
-
85
-
86
-
87
-
88
-
89
-
90
-
91
-
92
-
93
-
94
-
95
-
96
-
97
-
98
-
99
-
100
-
101
-
102
-
103
-
 104
104 -
 105
105 -
 106
106 -
 107
107 -
 108
108 -
 109
109 -
 110
110 -
 111
111 -
 112
112 -
 113
113 -
 114
114 -
 115
115 -
 116
116 -
 117
117 -
 118
118 -
 119
119 -
 120
120 -
 121
121 -
 122
122 -
 123
123 -
 124
124 -
125
-
126
-
127
-
128
-
129
-
130
-
131
-
132
-
133
-
134
-
135
-
136
-
137
-
138
-
139
-
140
-
141
-
142
-
143
-
144
-
145
-
146
-
147
-
148
-
149
-
150
-
151
-
152
-
153
-
154
-
155
-
156
-
157
-
158
-
159
-
160
-
161
-
162
-
163
-
164
-
165
-
166
-
167
-
168
-
169
-
170
-
171
-
172
-
173
-
174
-
175
-
176
-
177
-
178
-
179
-
180
-
181
-
182
-
183
-
184
-
185
-
186
-
187
-
188
 |
 |

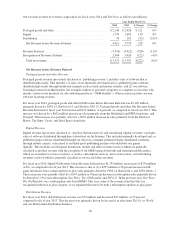
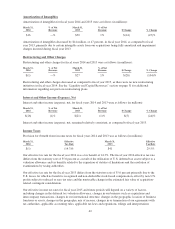
Service and Other Revenue
For fiscal year 2013, service and other revenue was $1,059 million, primarily driven by Star Wars: The Old
Republic and FIFA 13 Ultimate Team, as well as Battlefield 3 Premium subscriptions. Service and other revenue for
fiscal year 2013 increased $331 million, or 45 percent, as compared to fiscal year 2012. This increase was driven by
a $396 million increase primarily from services associated with the FIFA and Battlefield franchises, along with Star
Wars: The Old Republic (which launched in December 2011). This increase was partially offset by a $65 million
decrease from Pogo-branded online game services and certain franchises including Warhammer and Ultima Online.
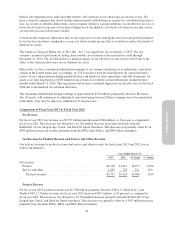
Net Revenue by Geography
Year Ended March 31,
(In millions) 2013 2012 $ Change % Change
North America ............................................ $1,701 $1,991 $(290) (15)%
International .............................................. 2,096 2,152 (56) (3)%
Total net revenue ........................................ $3,797 $4,143 $(346) (8)%
Net revenue in North America was $1,701 million, or 45 percent of total net revenue for fiscal year 2013, compared
to $1,991 million, or 48 percent of total net revenue for fiscal year 2012, a decrease of $290 million, or 15 percent.
This decrease was driven by a $657 million decrease from certain franchises including Battlefield, Dragon Age,
Portal, Crysis, and Need for Speed franchises. This decrease was offset by a $367 million increase primarily from the
Mass Effect franchise, as well as Star Wars: The Old Republic and Kingdoms of Amalur: Reckoning. International
net revenue was $2,096 million, or 55 percent of total net revenue during fiscal year 2013, compared to $2,152
million, or 52 percent of total net revenue during fiscal year 2012, a decrease of $56 million, or 3 percent. We
estimate that foreign exchange rates (primarily due to the Euro and Swiss Franc) decreased reported International net
revenue by approximately $127 million, or 6 percent, for fiscal year 2013. Excluding the effect of foreign exchange
rates from International net revenue, we estimate that International net revenue increased by approximately $71
million, or 3 percent, for fiscal year 2013 as compared to fiscal year 2012. This increase is primarily due to greater
revenue from our Battlefield, Crysis, Need for Speed, Dragon Age, and The Sims franchises, partially offset by
decreased revenue in our FIFA, Mass Effect, and FIFA Street franchises during fiscal year 2013.
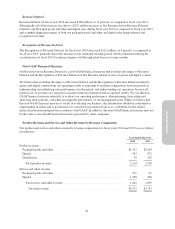
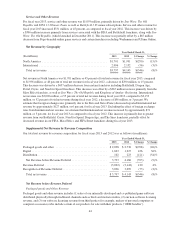
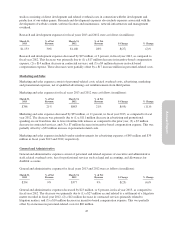
Supplemental Net Revenue by Revenue Composition
Our total net revenue by revenue composition for fiscal years 2013 and 2012 was as follows (in millions):
Year Ended March 31,
2013 2012 $ Change % Change
Packaged goods and other ................................... $2,028 $ 2,736 $(708) (26)%
Digital ................................................... 1,663 1,227 436 36%
Distribution ............................................... 102 223 (121) (54)%
Net Revenue before Revenue Deferral ........................ 3,793 4,186 (393) (9)%
Revenue Deferral .......................................... (3,022) (3,142) 120 4%
Recognition of Revenue Deferral .............................. 3,026 3,099 (73) (2)%
Total net revenue ........................................ $3,797 $ 4,143 $(346) (8)%
Net Revenue before Revenue Deferral
Packaged goods and Other Revenue
Packaged goods and other revenue includes (1) sales of our internally-developed and co-published game software
distributed physically through traditional channels such as brick and mortar retailers, (2) our non-software licensing
revenue, and (3) our software licensing revenue from third parties (for example, makers of personal computers or
computer accessories) who include certain of our products for sale with their products (“OEM bundles”).
44