Electronic Arts 2014 Annual Report Download - page 118
Download and view the complete annual report
Please find page 118 of the 2014 Electronic Arts annual report below. You can navigate through the pages in the report by either clicking on the pages listed below, or by using the keyword search tool below to find specific information within the annual report.-
 1
1 -
2
-
3
-
4
-
5
-
6
-
7
-
8
-
9
-
10
-
11
-
12
-
13
-
14
-
15
-
16
-
17
-
18
-
19
-
20
-
21
-
22
-
23
-
24
-
25
-
26
-
27
-
28
-
29
-
30
-
31
-
32
-
33
-
34
-
35
-
36
-
37
-
38
-
39
-
40
-
41
-
42
-
43
-
44
-
45
-
46
-
47
-
48
-
49
-
50
-
51
-
52
-
53
-
54
-
55
-
56
-
57
-
58
-
59
-
60
-
61
-
62
-
63
-
64
-
65
-
66
-
67
-
68
-
69
-
70
-
71
-
72
-
73
-
74
-
75
-
76
-
77
-
78
-
79
-
80
-
81
-
82
-
83
-
84
-
85
-
86
-
87
-
88
-
89
-
90
-
91
-
92
-
93
-
94
-
95
-
96
-
97
-
98
-
99
-
100
-
101
-
102
-
103
-
104
-
105
-
106
-
107
-
 108
108 -
 109
109 -
 110
110 -
 111
111 -
 112
112 -
 113
113 -
 114
114 -
 115
115 -
 116
116 -
 117
117 -
 118
118 -
 119
119 -
 120
120 -
 121
121 -
 122
122 -
 123
123 -
 124
124 -
 125
125 -
 126
126 -
 127
127 -
 128
128 -
129
-
130
-
131
-
132
-
133
-
134
-
135
-
136
-
137
-
138
-
139
-
140
-
141
-
142
-
143
-
144
-
145
-
146
-
147
-
148
-
149
-
150
-
151
-
152
-
153
-
154
-
155
-
156
-
157
-
158
-
159
-
160
-
161
-
162
-
163
-
164
-
165
-
166
-
167
-
168
-
169
-
170
-
171
-
172
-
173
-
174
-
175
-
176
-
177
-
178
-
179
-
180
-
181
-
182
-
183
-
184
-
185
-
186
-
187
-
188
 |
 |

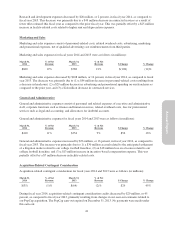
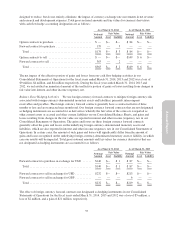
Acquisition-Related Contingent Consideration
Acquisition-related contingent consideration for fiscal years 2013 and 2012 were as follows (in millions):
March 31,
2013
% of Net
Revenue
March 31,
2012
% of Net
Revenue $ Change % Change
$(64) (2)% $11 —% $(75) (682)%
Acquisition-related contingent consideration expense decreased by $75 million, or 682 percent, in fiscal year
2013, as compared to fiscal year 2012, primarily resulting from decreases in our accrual related to our PopCap
acquisition.
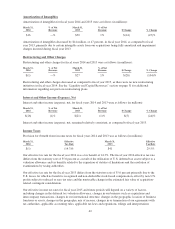
Amortization of Intangibles
Amortization of intangibles for fiscal years 2013 and 2012 were as follows (in millions):
March 31,
2013
% of Net
Revenue
March 31,
2012
% of Net
Revenue $ Change % Change
$30 1% $43 1% $(13) (30)%
Amortization of intangibles decreased by $13 million, or 30 percent, in fiscal year 2013, as compared to fiscal
year 2012, primarily due to certain intangible assets from our prior year acquisitions being fully amortized during
fiscal year 2012. This decrease was partially offset by $5 million of impairment charges recognized in fiscal year
2013.
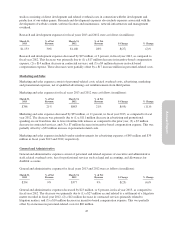
Restructuring and Other Charges
Restructuring and other charges for fiscal years 2013 and 2012 were as follows (in millions):
March 31,
2013
% of Net
Revenue
March 31,
2012
% of Net
Revenue $ Change % Change
$27 1% $16 —% $11 69%
During fiscal year 2013, restructuring and other charges increased by $11 million, or 69 percent, as compared to
fiscal year 2012, primarily due to (1) $22 million in costs in connection with our fiscal 2013 restructuring, which
was initiated in this fiscal year, and (2) a $10 million gain on the sale of our facility in Chertsey, England related
to our fiscal 2008 reorganization that was recognized during fiscal year 2012, and for which there was no
comparable gain in the current year. These increases were partially offset by costs that were recognized during
fiscal year 2012 comprised of (1) $15 million expense adjustment for the amendment of certain licensing
agreements related to our fiscal 2011 restructuring plan, and (2) $6 million in IT and other costs to assist in
reorganizing certain activities.
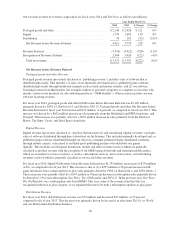
Gains on Strategic Investments, Net
Gains on strategic investments, net, for fiscal years 2013 and 2012 were as follows (in millions):
March 31,
2013
% of Net
Revenue
March 31,
2012
% of Net
Revenue $ Change % Change
$39 1% $— —% $39 —%
During fiscal year 2013, we sold our investment in Neowiz for proceeds of $72 million, and realized a gain of
$39 million, net of costs to sell. We did not recognize any impairment charges or losses on our marketable equity
securities during the year ended March 31, 2013.
48