Electronic Arts 2014 Annual Report Download - page 110
Download and view the complete annual report
Please find page 110 of the 2014 Electronic Arts annual report below. You can navigate through the pages in the report by either clicking on the pages listed below, or by using the keyword search tool below to find specific information within the annual report.-
 1
1 -
2
-
3
-
4
-
5
-
6
-
7
-
8
-
9
-
10
-
11
-
12
-
13
-
14
-
15
-
16
-
17
-
18
-
19
-
20
-
21
-
22
-
23
-
24
-
25
-
26
-
27
-
28
-
29
-
30
-
31
-
32
-
33
-
34
-
35
-
36
-
37
-
38
-
39
-
40
-
41
-
42
-
43
-
44
-
45
-
46
-
47
-
48
-
49
-
50
-
51
-
52
-
53
-
54
-
55
-
56
-
57
-
58
-
59
-
60
-
61
-
62
-
63
-
64
-
65
-
66
-
67
-
68
-
69
-
70
-
71
-
72
-
73
-
74
-
75
-
76
-
77
-
78
-
79
-
80
-
81
-
82
-
83
-
84
-
85
-
86
-
87
-
88
-
89
-
90
-
91
-
92
-
93
-
94
-
95
-
96
-
97
-
98
-
99
-
 100
100 -
 101
101 -
 102
102 -
 103
103 -
 104
104 -
 105
105 -
 106
106 -
 107
107 -
 108
108 -
 109
109 -
 110
110 -
 111
111 -
 112
112 -
 113
113 -
 114
114 -
 115
115 -
 116
116 -
 117
117 -
 118
118 -
 119
119 -
 120
120 -
121
-
122
-
123
-
124
-
125
-
126
-
127
-
128
-
129
-
130
-
131
-
132
-
133
-
134
-
135
-
136
-
137
-
138
-
139
-
140
-
141
-
142
-
143
-
144
-
145
-
146
-
147
-
148
-
149
-
150
-
151
-
152
-
153
-
154
-
155
-
156
-
157
-
158
-
159
-
160
-
161
-
162
-
163
-
164
-
165
-
166
-
167
-
168
-
169
-
170
-
171
-
172
-
173
-
174
-
175
-
176
-
177
-
178
-
179
-
180
-
181
-
182
-
183
-
184
-
185
-
186
-
187
-
188
 |
 |

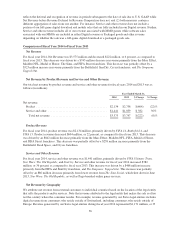
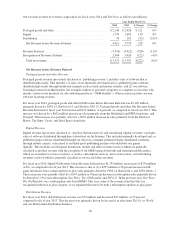
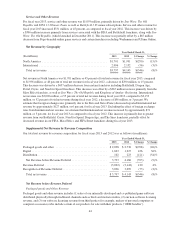
Cost of Revenue
Total cost of revenue for fiscal years 2014 and 2013 was as follows (in millions):
March 31,
2014
%of
Related Net
Revenue
March 31,
2013
%of
Related Net
Revenue % Change
Change as a
% of Related
Net Revenue
Cost of revenue:
Product .............................. $1,032 48.4% $1,085 39.6% (4.9)% 8.8%
Service and other ...................... 315 21.9% 303 28.6% 4.0% (6.7)%
Total cost of revenue ................. $1,347 37.7% $1,388 36.6% (3.0)% 1.1%
Cost of Product Revenue
Cost of product revenue consists of (1) product costs, (2) certain royalty expenses for celebrities, professional
sports and other organizations, and independent software developers, (3) manufacturing royalties, net of volume
discounts and other vendor reimbursements, (4) expenses for defective products, (5) write-offs of post launch
prepaid royalty costs, (6) amortization of certain intangible assets, (7) personnel-related costs, and
(8) warehousing and distribution costs. We generally recognize volume discounts when they are earned from the
manufacturer (typically in connection with the achievement of unit-based milestones); whereas other vendor
reimbursements are generally recognized as the related revenue is recognized.
Cost of product revenue decreased by $53 million, or 4.9 percent in fiscal year 2014, as compared to fiscal year
2013. The decrease was primarily due to intangible impairment charges incurred in fiscal year 2013 compared to
an immaterial amount of such charges incurred during fiscal year 2014, and a decrease in royalty costs due to
fewer royalty-bearing products released during fiscal year 2014, as compared to fiscal year 2013.
Cost of Service and Other Revenue
Cost of service and other revenue consists primarily of (1) data center and bandwidth costs associated with
hosting our online games and websites, (2) associated royalty costs, (3) credit card fees associated with our
service revenue, (4) server costs related to our website advertising business, and (5) platform processing fees
from operating our website-based games on third party platforms.
Cost of service and other revenue increased by $12 million, or 4.0 percent in fiscal year 2014, as compared to
fiscal year 2013. The increase was primarily due to an increase in product costs due to the release of Titanfall and
an increase in royalty costs due to more royalty-bearing services released during fiscal year 2014, as compared to
fiscal year 2013.
Total Cost of Revenue as a Percentage of Total Net Revenue
Total cost of revenue as a percentage of total net revenue remained relatively consistent during fiscal year 2014
as compared to fiscal year 2013.
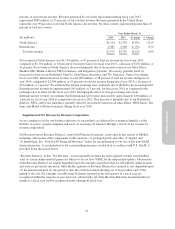
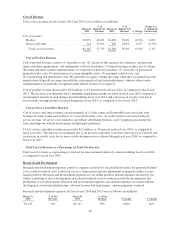
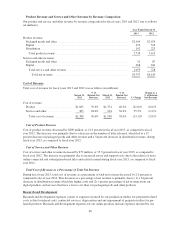
Research and Development
Research and development expenses consist of expenses incurred by our production studios for personnel-related
costs, related overhead costs, contracted services, depreciation and any impairment of prepaid royalties for pre-
launch products. Research and development expenses for our online products include expenses incurred by our
studios consisting of direct development and related overhead costs in connection with the development and
production of our online games. Research and development expenses also include expenses associated with the
development of network infrastructure, software licenses and maintenance, and management overhead.
Research and development expenses for fiscal years 2014 and 2013 were as follows (in millions):
March 31,
2014
% of Net
Revenue
March 31,
2013
% of Net
Revenue $ Change % Change
$1,125 31% $1,153 30% $(28) (2)%
40