Electronic Arts 2014 Annual Report Download - page 65
Download and view the complete annual report
Please find page 65 of the 2014 Electronic Arts annual report below. You can navigate through the pages in the report by either clicking on the pages listed below, or by using the keyword search tool below to find specific information within the annual report.-
 1
1 -
2
-
3
-
4
-
5
-
6
-
7
-
8
-
9
-
10
-
11
-
12
-
13
-
14
-
15
-
16
-
17
-
18
-
19
-
20
-
21
-
22
-
23
-
24
-
25
-
26
-
27
-
28
-
29
-
30
-
31
-
32
-
33
-
34
-
35
-
36
-
37
-
38
-
39
-
40
-
41
-
42
-
43
-
44
-
45
-
46
-
47
-
48
-
49
-
50
-
51
-
52
-
53
-
54
-
 55
55 -
 56
56 -
 57
57 -
 58
58 -
 59
59 -
 60
60 -
 61
61 -
 62
62 -
 63
63 -
 64
64 -
 65
65 -
 66
66 -
 67
67 -
 68
68 -
 69
69 -
 70
70 -
 71
71 -
 72
72 -
 73
73 -
 74
74 -
 75
75 -
76
-
77
-
78
-
79
-
80
-
81
-
82
-
83
-
84
-
85
-
86
-
87
-
88
-
89
-
90
-
91
-
92
-
93
-
94
-
95
-
96
-
97
-
98
-
99
-
100
-
101
-
102
-
103
-
104
-
105
-
106
-
107
-
108
-
109
-
110
-
111
-
112
-
113
-
114
-
115
-
116
-
117
-
118
-
119
-
120
-
121
-
122
-
123
-
124
-
125
-
126
-
127
-
128
-
129
-
130
-
131
-
132
-
133
-
134
-
135
-
136
-
137
-
138
-
139
-
140
-
141
-
142
-
143
-
144
-
145
-
146
-
147
-
148
-
149
-
150
-
151
-
152
-
153
-
154
-
155
-
156
-
157
-
158
-
159
-
160
-
161
-
162
-
163
-
164
-
165
-
166
-
167
-
168
-
169
-
170
-
171
-
172
-
173
-
174
-
175
-
176
-
177
-
178
-
179
-
180
-
181
-
182
-
183
-
184
-
185
-
186
-
187
-
188
 |
 |

Proxy Statement
APPENDIX A
RECONCILIATION OF NON-GAAP FINANCIAL MEASURES TO THE MOST DIRECTLY
COMPARABLE GAAP FINANCIAL MEASURES
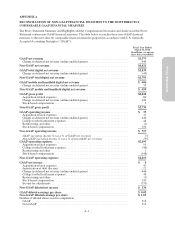
The Proxy Statement Summary and Highlights and the Compensation Discussion and Analysis in this Proxy
Statement contain non-GAAP financial measures. The table below reconciles these non-GAAP financial
measures to the most directly comparable financial measures prepared in accordance with U.S. Generally
Accepted Accounting Principles (“GAAP”):
Fiscal Year Ended
March 31, 2014
(In millions, except per
share data, unaudited)
GAAP net revenue ......................................................... $3,575
Change in deferred net revenue (online-enabled games) .......................... 446
Non-GAAP net revenue ..................................................... $4,021
GAAP total digital net revenue ............................................... $1,833
Change in deferred net revenue (online-enabled games) .......................... (40)
Non-GAAP total digital net revenue .......................................... $1,793
GAAP mobile and handheld digital net revenue ................................ $ 406
Change in deferred net revenue (online-enabled games) .......................... 53
Non-GAAP mobile and handheld digital net revenue ............................ $ 459
GAAP gross profit ......................................................... $2,228
Acquisition-related expenses ................................................ 60
Change in deferred net revenue (online-enabled games) .......................... 446
Stock-based compensation .................................................. 2
Non-GAAP gross profit ..................................................... $2,736
GAAP operating income .................................................... $33
Acquisition-related expenses ................................................ 41
Change in deferred net revenue (online-enabled games) .......................... 446
College football settlement expenses .......................................... 48
Restructuring and other .................................................... (1)
Stock-based compensation .................................................. 150
Non-GAAP operating income ................................................ $ 717
GAAP operating income % (as a % of GAAP net revenue) ........................ 1%
Non-GAAP operating income % (as a % of non-GAAP net revenue) ................. 18%
GAAP operating expenses ................................................... $2,195
Acquisition-related expenses ................................................ 19
College football settlement expenses .......................................... (48)
Restructuring and other .................................................... 1
Stock-based compensation .................................................. (148)
Non-GAAP operating expenses .............................................. $2,019
GAAP net income .......................................................... $8
Acquisition-related expenses ................................................ 41
Amortization of debt discount ............................................... 21
Change in deferred net revenue (online-enabled games) .......................... 446
College football settlement expenses .......................................... 48
Restructuring and other .................................................... (1)
Stock-based compensation ................................................. 150
Income tax adjustments .................................................... (179)
Non-GAAP diluted net income ............................................... $ 534
GAAP diluted earnings per share ............................................ $ 0.03
Non-GAAP diluted earnings per share ........................................ $ 1.69
Number of diluted shares used in computation
GAAP .................................................................. 316
Non-GAAP ............................................................. 316
A-1